




TLDR
- SUI traded near $0.81 after rebounding from lows around $0.70.
- The $0.82–$0.85 zone is the main resistance area on the daily chart.
- RSI has climbed to about 59.5 while MACD has turned positive.
- Bitcoin moved back above $80,000 after the Fed rate hike and CLARITY Act vote.
- Support remains around $0.67–$0.70, with $0.90 and $1.00 above resistance.
Sui was trading near $0.812 on Friday as the token approached a descending trend line that has limited price gains for several months.
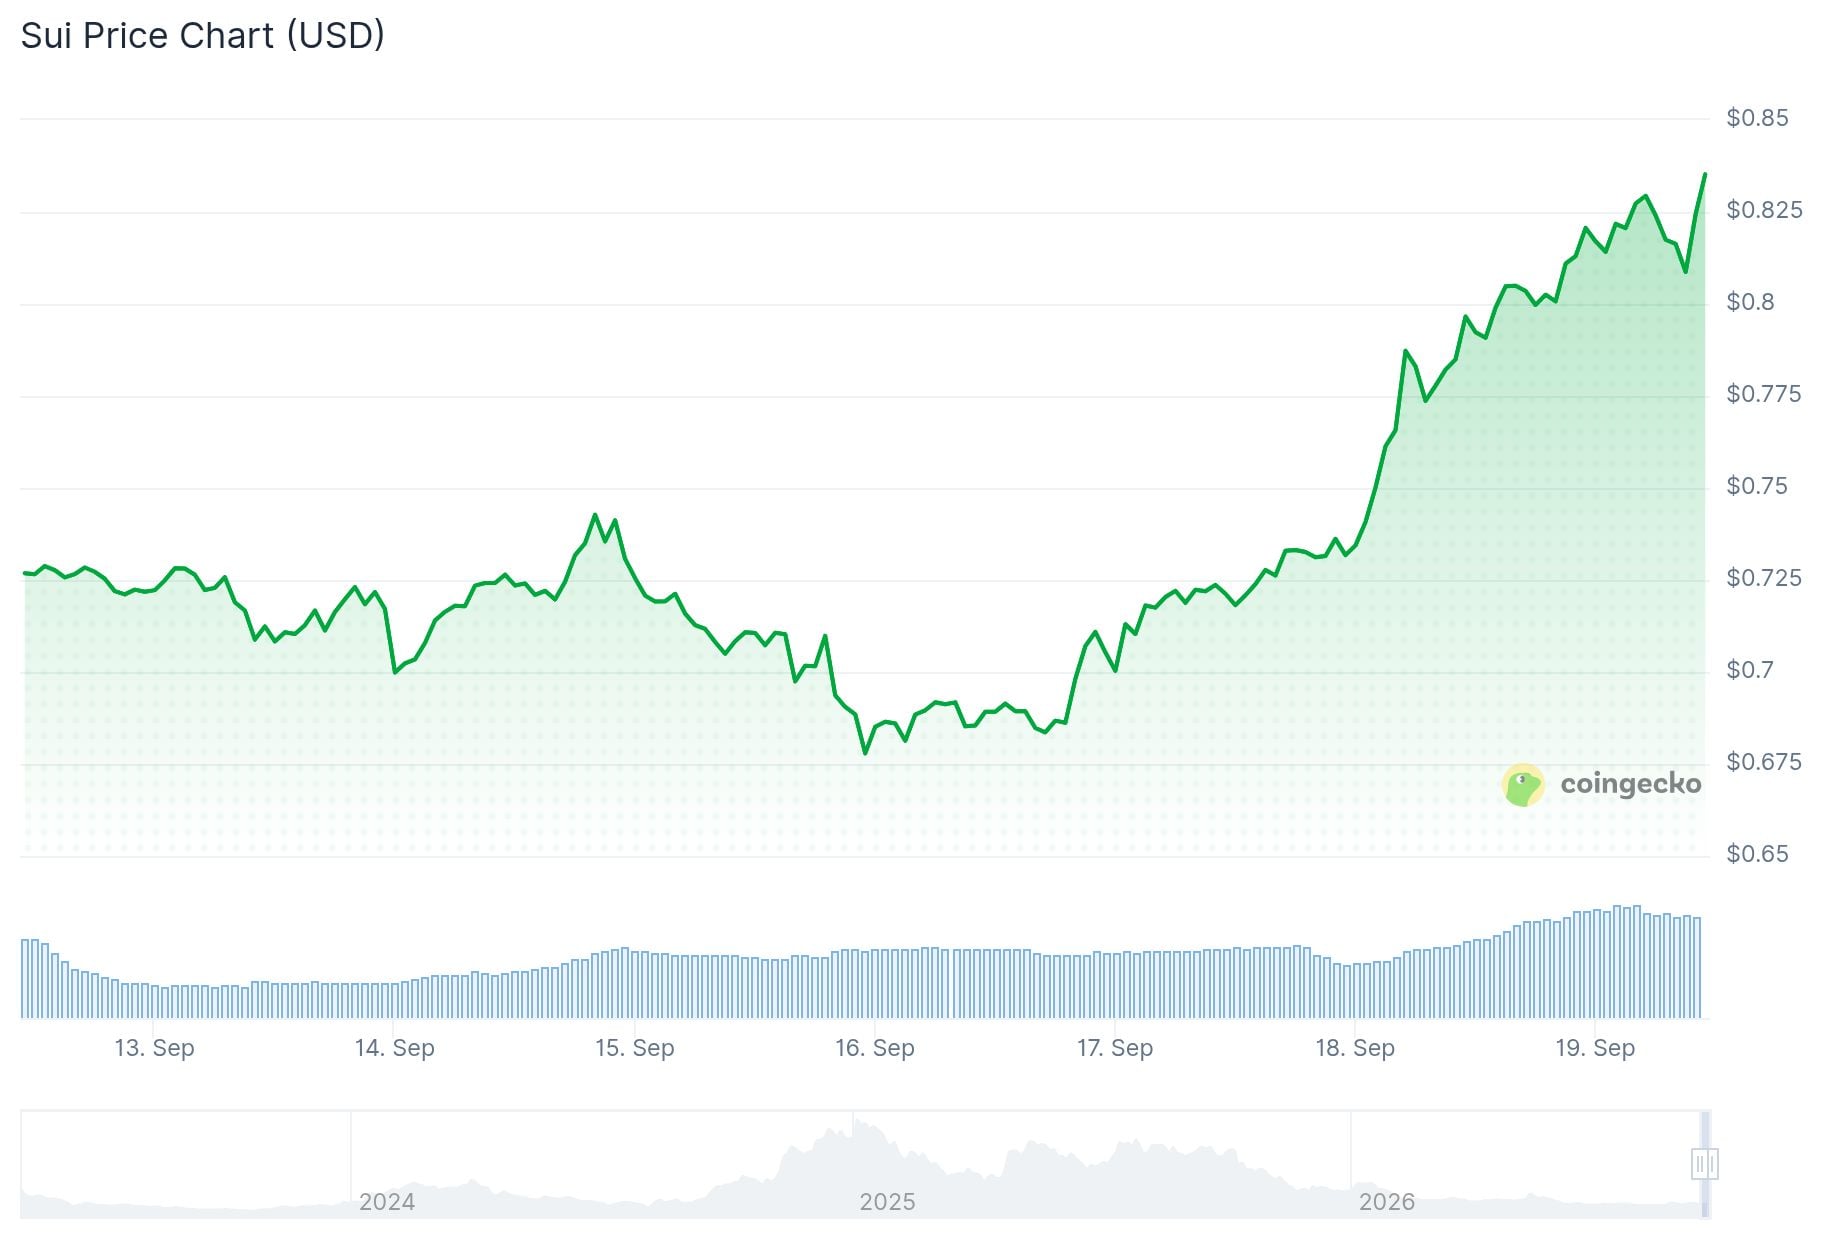
SUI has recovered from recent lows near $0.70. The rebound has brought the token back toward the $0.81–$0.83 area.
That zone is important because the descending trend line stretches back to SUI’s May peak above $1.30. Previous attempts to move through the line have failed.
The supplied Coinbase daily chart shows momentum improving. The relative strength index has risen to around 59.5, putting it above the neutral 50 level.
MACD has also improved. The MACD line has moved above the signal line, while the histogram has returned to positive territory.
SUI Follows Wider Crypto Market Recovery
SUI’s move comes as the wider cryptocurrency market recovers from a difficult week driven by monetary policy and U.S. regulation.
Bitcoin climbed back above $80,000 on Friday, gaining around 5.7%. Several altcoins also moved higher as selling pressure eased.

The recovery followed the Federal Reserve’s latest interest-rate increase. The Fed raised rates for the first time since 2023 and indicated another increase could still take place before year-end.
Crypto prices initially came under pressure following the decision. Bitcoin and major altcoins later recovered as traders moved past the announcement.
Something very unusual is happening in the crypto market right now.
Bitcoin just absorbed 5 major bearish headlines in a single week, and it’s still green over the week.
1. The CLARITY Act failed in the Senate.
2. The Fed hiked rates.
3. The Bank of Japan hiked rates.
4. The… pic.twitter.com/T71wRKmJhp— Bull Theory (@BullTheoryio) September 18, 2026
U.S. regulation has also been in focus. The Senate failed to advance the Digital Asset Market CLARITY Act after the bill fell short of the 60 votes required to move forward.
The legislation was intended to establish clearer federal rules covering digital-asset markets. Its failure leaves questions over token classification, exchange supervision and regulatory authority unresolved.
$0.83 Remains the Main SUI Price Level
SUI is now testing resistance around $0.82–$0.85. A daily close above this range would also take price through the descending trend line.
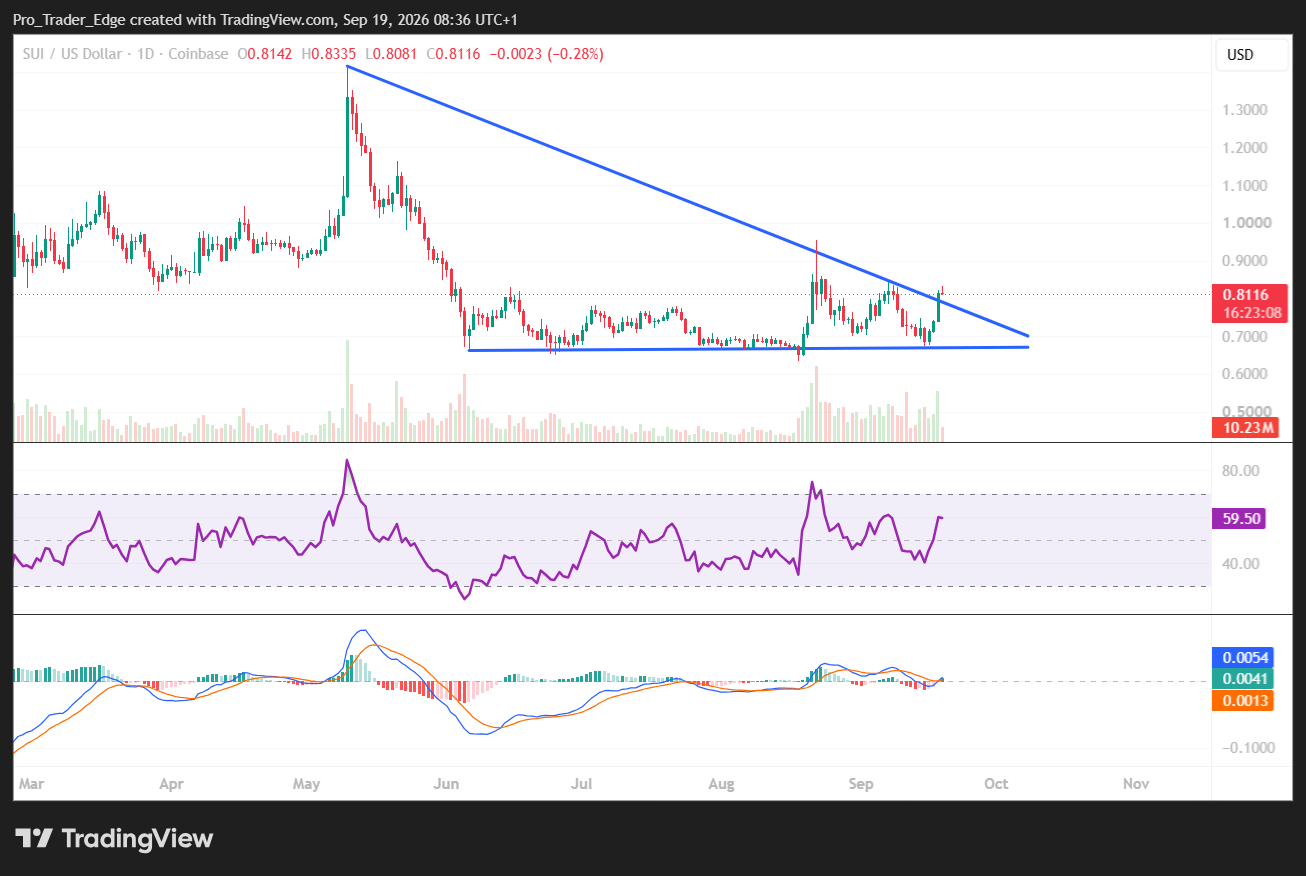
The next visible price area sits near $0.90. Above that, $1.00 is the next major round-number level shown by the recent price structure.
On the downside, the $0.67–$0.70 area remains the main support zone. Buyers have previously stepped in around this range during declines since June.
Outside the chart, Sui continues to develop its Layer-1 network around the Move programming language, with activity focused on areas including decentralized finance, payments and gaming.
Institutional interest has also continued, with Nasdaq previously filing to list a 21Shares SUI ETF. The filing would provide another route for traditional investors to gain exposure to SUI.
As of the supplied daily chart, SUI remained near $0.812, leaving the token just below the $0.83 area and its multi-month descending trend line.



Be the first to comment