



What to know:
- BONK price is consolidating within a symmetrical triangle, a pattern that often precedes a strong breakout.
- Technical indicators show bearish momentum is fading as traders await a bullish MACD crossover.
- The BONK price is recovering from recent losses, with the RSI rebounding from oversold levels.

The BONK price is consolidating within a symmetrical triangle, signaling growing breakout potential as price action tightens. Although short-term momentum remains slightly bearish, selling pressure is weakening while buying interest gradually improves, keeping traders focused on a possible bullish move if resistance is cleared.
At the time of writing, BONK is trading at $0.000002934 with a 24-hour trading volume of $54.06 million and a market capitalization of $258.14 million. After the 5.24% loss over the last 24 hours, the BONK price structure points to a bullish reversal, but weak technicals point to pressure.


Source: CoinMarketCap

Also Read: BONK Price Eyes Breakout to $0.00000350 Despite Treasury Wallet Selling Pressure
BONK Price Setup Signals Breakout Potential
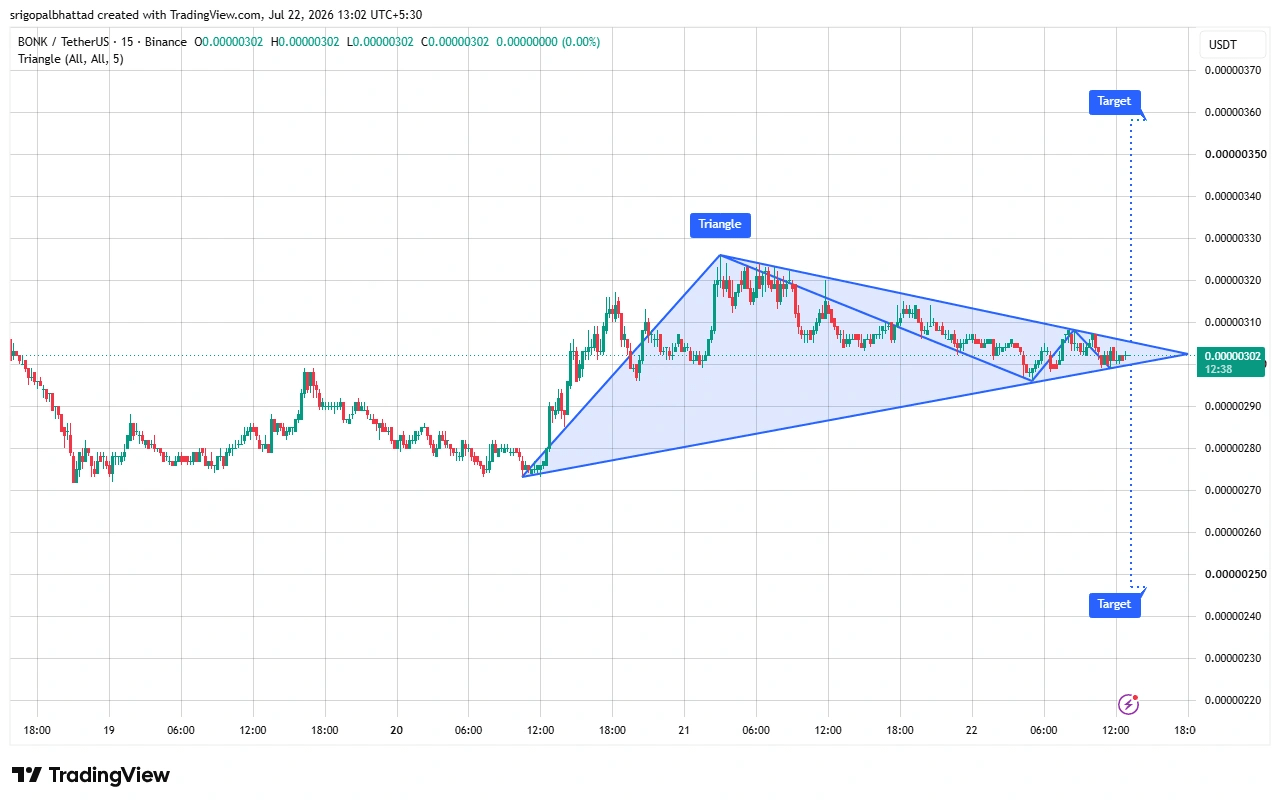
According to the crypto analyst Crypto With Gopal, BONK is consolidating within a symmetrical triangle, a technical pattern that reflects tightening price action as buyers continue forming higher lows while sellers defend overhead resistance.
The narrowing range signals increasing market tension, with bullish interest remaining intact despite repeated rejections. Traders are closely monitoring the setup for a decisive directional breakout ahead.

Source: Crypto With Gopal’s X Post
Experts have stated that the BONK price has come to a critical point where volatility can occur in an instant. In case of a breakout above the resistance level of the triangle formation, the BONK price can reach $0.0000036, supported by high volumes of trade. This will be positive and mean that buyers are back in control.
BONK Technicals Support Cautious Momentum
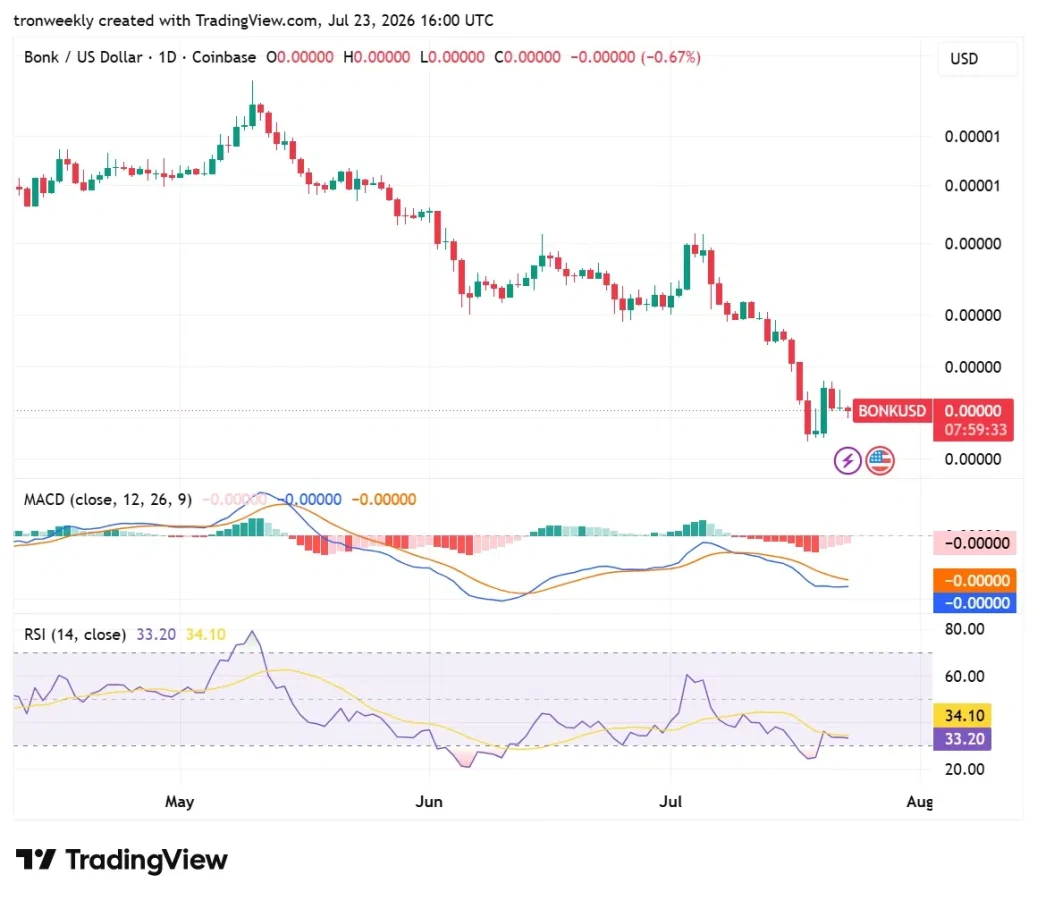
According to TradingView, the MACD remains in bearish mode, considering that the MACD line is below the signal line while the histogram remains negative.
However, the reduction of the histogram gives the impression that the bearish momentum is fading gradually. A bullish cross is yet to be confirmed, indicating that the sellers retain short-term dominance.
Source: TradingView
The RSI currently stands at 33, remaining below the 50 neutral level following a rally from the oversold region.
The rally indicates a slight improvement in the buyers’ mood; however, the momentum is sluggish. Until the RSI moves above its moving average line towards 50, the technical outlook remains negative.
What Happens Next?
The future performance of the BONK price is contingent upon buyers breaking out of the symmetrical triangle pattern in terms of price action along with significant trading volumes.
The breakout will trigger new bulls coming into the trade, while failure to break the resistance may result in BONK consolidating or even falling towards support again.
Also Read: BONK Price Analysis: Symmetrical Triangle Hints at Major Move to $0.00000035?
This article contains market analysis and price predictions. These are not guarantees. Crypto markets are volatile. Always DYOR. Not financial advice.



Be the first to comment