


Ethereum is consolidating after a sharp breakout from the $1.9K area, with ETH currently trading below $2.5K. The technical structure has improved considerably, while the continued decline in exchange reserves provides a supportive backdrop.
However, ETH’s $2.5K resistance zone is a meaningful one, and a breakout or rejection from this level is key to determining whether the recovery can extend or the recent price surge was just a bull trap.
Ethereum Price Analysis: The Daily Chart
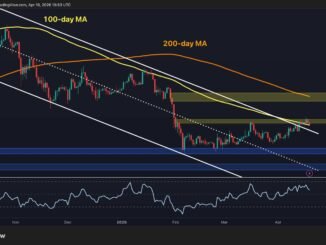
The daily chart shows a significant structural improvement over the past several weeks. ETH broke above the descending channel that had contained the price throughout the past few months, subsequently reclaiming the $1.9K region and then accelerating sharply higher.
The breakout also pushed ETH through the $2.1K resistance zone before the asset surged toward the current $2.5K area. The move also brought ETH above both the 100-day (~$1.9K) and 200-day (~$2.05K) major moving averages. These moving averages are also now sloping upward, which suggests that the broader bearish structure is losing momentum and a structural bullish shift might be occurring.
As already mentioned, ETH is now trading inside a resistance zone around $2.45K-$2.55K. This area has repeatedly attracted selling pressure in recent sessions, with several candles failing to establish a decisive breakout above $2.5K. A daily close above this region would strengthen the bullish continuation scenario and could expose the next major resistance around $3K and potentially higher.
On the downside, the first important support is around $2.1K. This zone is particularly significant because it previously acted as resistance and was decisively reclaimed during the latest rally. A pullback that holds this area would therefore keep the bullish breakout structure intact.
Below it, the $1.9K zone represents another important support region and serves as the initial point of the breakout. Therefore, a sustained move back below it would weaken the current bullish structure and raise the risk that the recent breakout was just a failed recovery preceding a deeper decline.

ETH/USDT 4-Hour Chart
The 4-hour chart provides a clearer view of August’s price action and the current consolidation. Following the vertical breakout from $1.9K, ETH initially pushed above $2.3K and continued toward $2.5K. Since then, the price has been moving sideways within a relatively tight range, with the $2.5K level acting as the upper boundary.
This consolidation can be interpreted constructively as long as ETH continues to hold the higher levels established during the breakout. The market is effectively digesting a very aggressive upward move rather than immediately giving back the entire rally.
Therefore, the immediate resistance remains around $2.5K. A decisive 4-hour breakout and sustained trading above this zone would provide confirmation that buyers are regaining control and could open the way toward higher daily-chart resistance.
Looking below, the first notable support lies around $2.2K-$2.3K. This zone coincides with a bullish order block, where the latest acceleration higher began, and could therefore attract buyers if ETH undergoes a deeper retracement.
The next support is around $2.05K-$2.1K, and holding this area would be particularly important, as a drop below it would also lead to a decline below the $2K psychological level and could quickly damage market sentiment.
Meanwhile, the 4-hour RSI has pulled back from overbought territory and is hovering around 50. This is consistent with a cooling-off phase following the breakout rather than an outright momentum breakdown. A renewed move above the $2.5K area while RSI expands again would strengthen the continuation setup, but this scenario will likely materialize after further consolidation or correction, as the market seems over-extended in the short-term.

Sentiment Analysis
The exchange-reserve chart provides a notably constructive signal for Ethereum. ETH held on exchanges has declined steadily from above 21M ETH in 2025 to approximately 14.9M ETH at the latest reading shown on the chart. The decline has even become steeper over the past couple of months.
At the same time, ETH’s price has recovered from $1.5K to approximately $2.4K. The divergence is important because the declining exchange reserve suggests that a smaller quantity of ETH is sitting on exchanges and potentially immediately available for selling. While exchange reserves alone cannot determine future price direction, sustained withdrawals can reduce readily available sell-side supply if the trend reflects longer-term accumulation or movement into self-custody and other non-exchange venues.
The chart also shows that the decline in exchange reserves has persisted even through periods of significant price volatility. This makes the current supply-side backdrop more constructive than if reserves were rising alongside the latest rally.
As a result, the technical and on-chain pictures are currently aligned. ETH has broken its longer-term descending trend, reclaimed the key $2K area, and is consolidating near the next resistance while exchange reserves continue to fall. This shrinking supply might just need a slight demand push from the spot or the futures market to result in a breakout and a further rally.

Disclaimer: Information found on CryptoPotato is those of writers quoted. It does not represent the opinions of CryptoPotato on whether to buy, sell, or hold any investments. You are advised to conduct your own research before making any investment decisions. Use provided information at your own risk. See Disclaimer for more information.





Be the first to comment