



Bitcoin trades at $62,980, down 2.7% over 24 hours, having lost the support band it was defending only hours earlier.
Key Takeaways
- Bitcoin lost the $63,400 support it defended this afternoon, trading at $62,980.
- The yen gained 2.91% this week on two interventions, squeezing yen-funded positions.
- The 30-year Treasury yield trades at 5.275%, heading for its highest monthly close since 2007.
- Three Fed dissenters, the first such split since 2016, told markets the policy anchor is contested.
The end of the week was supposed to be easy one. The Federal Reserve held on July 29, the Bank of Japan held on July 31, and the rate shock that would have squeezed leveraged positioning never came.
It came from the currency market instead, and from a bond market that spent July repricing without waiting for anyone’s permission.
The Yen Squeeze Was Live This Week
The carry trade we wrote about this morning did not stay theoretical.
Across five sessions the yen gained 2.9% against the dollar, its biggest weekly rise since February, in two near-vertical moves. On Thursday, Japanese authorities reportedly intervened to the tune of roughly 8.45 trillion yen, around $53 billion, among the largest single-day currency actions on record, pulling the yen off a four-decade low near 163.94. The BOJ then held at 1.0% on Friday morning and the yen weakened back above 160, before the US Treasury informed banks through the New York Fed that it may intervene and they should “stand ready for future action.” The yen strengthened to 159.61.
It held both moves, closing the week at its strongest level rather than retracing the way single interventions usually do.
A funding currency appreciating 2.9% in a week makes every yen-borrowed position more expensive to repay. Traders closing those positions raise cash by selling their most liquid holdings, and Bitcoin fell 1.85% across the same week, with 2.68% drop in the last 24 hours as the yen made its second jump. Two markets moving apart across one window proves nothing on its own. It is the pattern the carry-unwind mechanism predicts, appearing in the week the mechanism was most active.
Why Japan’s Defence Reaches the Bond Market
Japan is the largest foreign holder of US government debt, which turns a yen crisis into a US borrowing-cost crisis through three channels.
- Forced selling: Defending the yen means buying it, and Tokyo funds that partly by selling reserves weighted heavily toward US government bonds.
- Carry unwind: Funds closing yen-borrowed positions sell assets to repay the loans, which is the channel that most likely reached crypto this week.
- Repatriation: Japanese life insurers and pension funds have anchored demand for US long-duration debt for decades. With domestic yields at multi-year highs and another BOJ hike expected, holding low-yield American paper stops making sense.
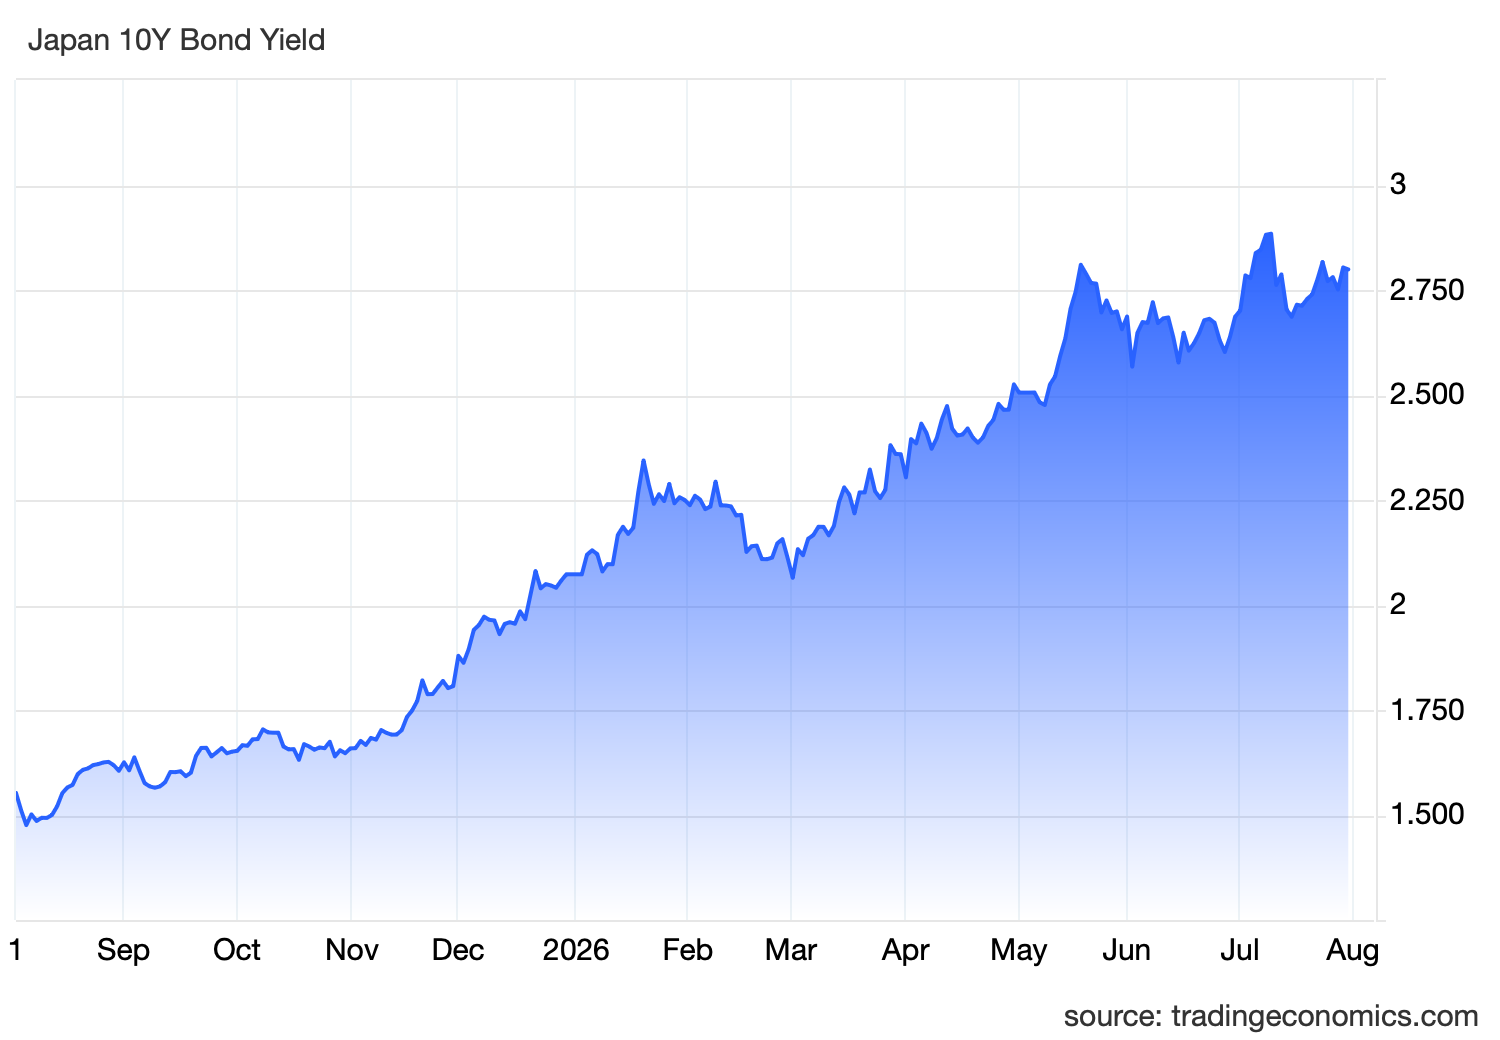
The reported Thursday’s operation probably ran through the first of those. Dollars on that scale come from reserves, and Japan’s reserves are Treasuries.
What happens next depends on who acts. If Japan defends the yen alone, it sells more US debt to raise dollars and pushes yields higher. If Washington acts through its Exchange Stabilization Fund, which held roughly $217 billion at the end of June, Tokyo faces less pressure to liquidate and that supply channel narrows. The last US intervention to support the yen came in 2011, a G7 action after the earthquake and tsunami.
American participation might be the better outcome for crypto, and it arrives with an immediate cost. Coordinated intervention forces yen shorts to close fast, and a rapid unwind produces turbulence across bonds and equities that reaches crypto first.
The Other Pressure: Yields Repricing All Month
The currency move landed on a market already absorbing the steepest long-end repricing in years.
The 30-year Treasury yield trades at 5.275%, and tonight’s monthly close will be the highest since 2007. It opened July at 4.955% and has added 32.4 basis points, a 6.5% move in four weeks, with the steepest part arriving after the Fed’s decision.
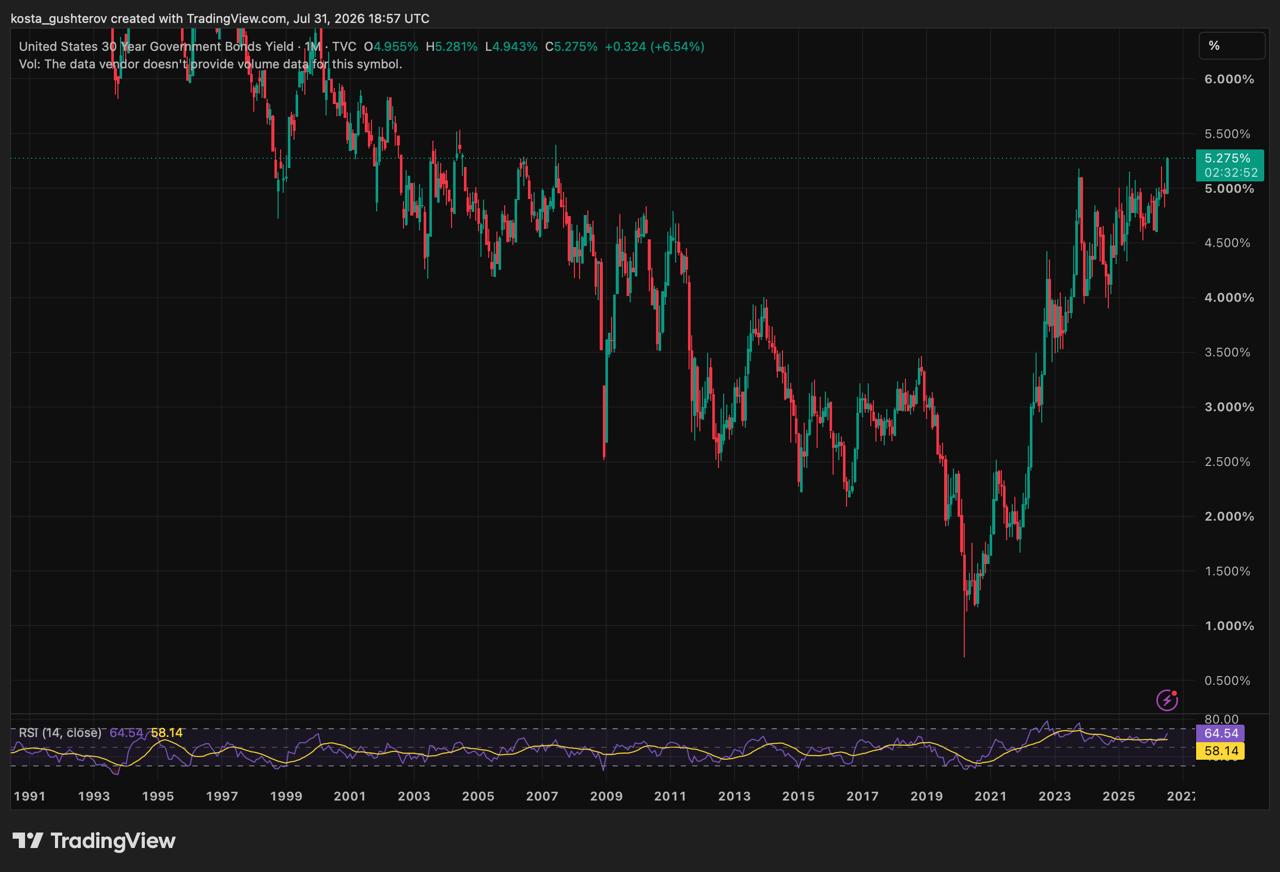
That rise comes from two separate mechanisms, and reading them as one obscures what each means.
The 2-year yield trades at 4.291%, up 0.96% today and roughly 89 basis points above its early March level near 3.40%. That end of the curve tracks Fed expectations, and it is rising because traders think a hike is coming. CME FedWatch puts roughly 65% odds on a September 16 increase against 35% for another hold.
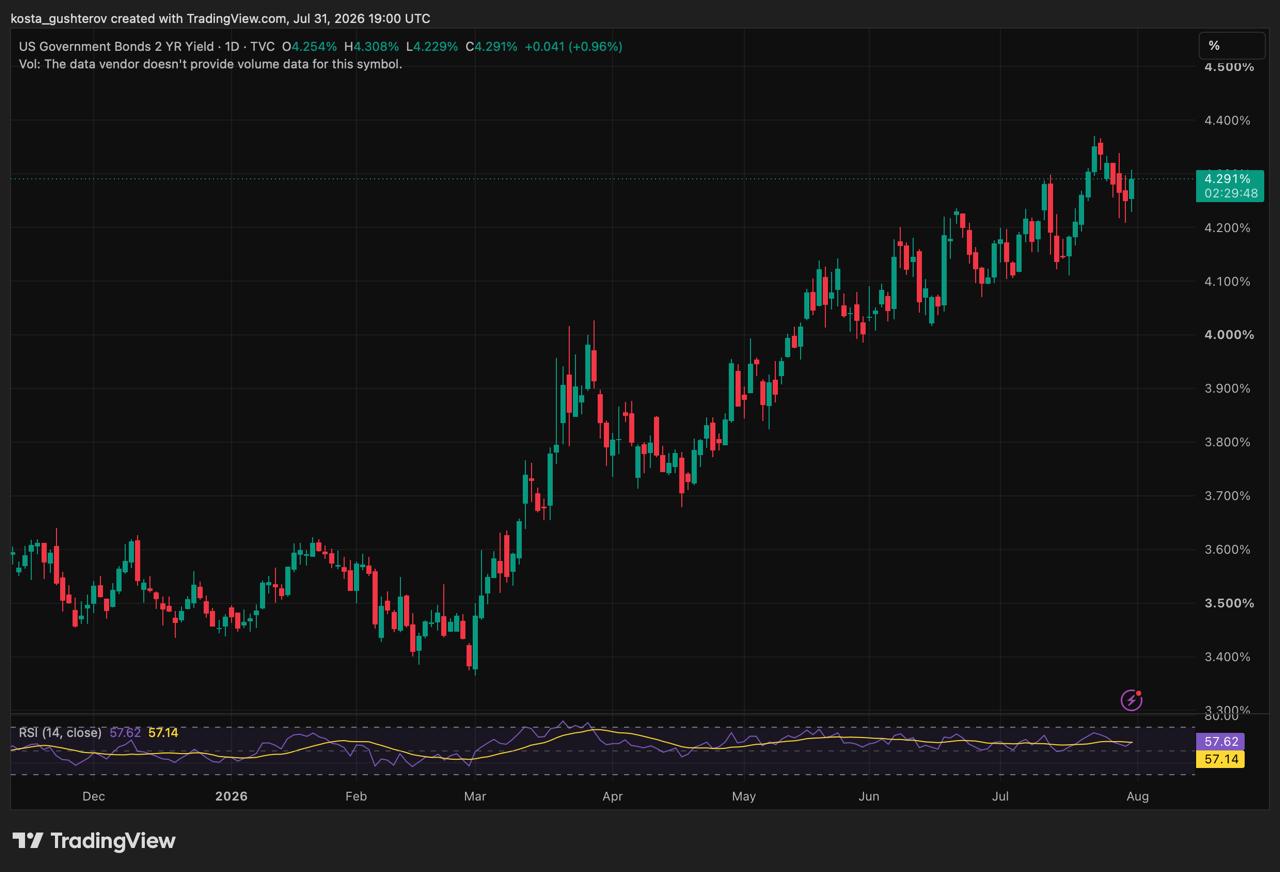
The long end responds to fiscal supply. Bloomberg’s framing of the July 9 auction named it directly: swelling bond supply is driving investors to demand higher returns. Those bonds cleared at 5.058%, the highest auction yield since 2007, though below pre-auction trading levels. Demand exceeded expectations at that price, which describes a market finding a new equilibrium rather than one breaking down.
US federal debt runs near $40 trillion, annual interest costs have passed $1 trillion, and the deficit sits around $2 trillion a year, which is why that equilibrium keeps moving higher. Every basis point raises the cost of rolling the existing stock and funding the next round.
The 10-year, which sets mortgage rates rather than the Fed’s overnight rate, trades near 4.73% after sitting below 4% before the Iran energy shock. That is the number reaching households, and it has moved further in proportional terms than the long bond.
Front end pricing policy, long end pricing debt, both rising together. A policy-driven move can reverse when inflation cools. A supply-driven one persists as long as governments keep borrowing.
What That Does to an Asset Paying Nothing
Bitcoin produces no yield. In an environment of cheap money that is a technical detail. At 5.275% it becomes an allocation problem.
Put it in cash terms. $100,000 in the 30-year now pays roughly $5,275 a year, guaranteed, for three decades. The same amount in Bitcoin pays nothing and is currently worth about half what it was at the peak. That comparison sits in front of every institution holding crypto through a mandate, and institutions are the holders who can be required to act on it rather than simply choosing to wait.
Every percentage point available on government debt raises what an investor gives up by holding something that pays nothing. When the long bond sat near 0.7% in 2020, the comparison was academic. A guaranteed return above 5% over three decades competes hardest with exactly the argument crypto needs during a drawdown: hold and wait.
The faster channel is portfolio flow. Allocators rebalancing toward fixed income reduce their riskiest positions, and crypto trades around the clock at the far end of that spectrum. The mechanism needs no Fed decision and no crypto-specific news, which is why a support level can break on a day when nothing happened in crypto.
The Support Broke as the Month Closed
This afternoon Bitcoin was holding a support confluence near $63,400, where the 0.236 Fibonacci retracement and the 50-day moving average sat within $200 of each other. The session low reached $63,546 and buyers pushed it back.
That defence has since failed. Price sits roughly $420 below the 50-day average, and the level that stopped every pullback for a week is overhead rather than underneath.
Nothing in crypto explains it. The CoinMarketCap 20 index is down 2.4% over the same 24 hours, and Bitcoin’s weekly loss sits alongside a 1.20% decline across the broader basket. The catalysts were in Tokyo and the US debt market.
The Bond Vigilantes Are Back
Three regional Fed presidents dissented on July 29 in favour of an immediate quarter-point increase: Beth Hammack of Cleveland, Neel Kashkari of Minneapolis and Lorie Logan of Dallas. Dissents are usually one voice, occasionally two. Three members breaking from the majority and all demanding the same thing has not happened since September 2016.
Chair Kevin Warsh, in the role since May 22, repeated that the Fed would not hesitate to return inflation to 2% while declining to say how or when. Inflation has run above target for more than five years and worsened after the Iran energy shock, and Warsh acknowledged that parts of the business community now expect the target itself to be loosened.
Investors who sell bonds to force discipline on a central bank have a name from the 1980s. Ed Yardeni, who coined “bond vigilantes,” described the current move as the market keeping order because the Fed will not.
His conclusion runs against intuition. To bring long-term yields down, the Fed may have to raise short-term rates first, because long yields depend less on the policy rate than on confidence that inflation will be controlled. That is one analyst’s reading, and it explains why sessions without a clear tightening signal have pushed yields higher.
For crypto it complicates the usual playbook. A hawkish September would tighten the front of the curve, which hurts. It might also ease pressure at the long end, which helps. The two effects pull against each other, and which dominates is genuinely unclear.
The Debasement Case, and Why It Arrives Late
A serious counter-argument runs the other way.
If long yields are rising because investors doubt governments can fund themselves without debasing the currency, that is the scenario Bitcoin was built for. Fiscal dominance is a monetary-integrity story, and monetary-integrity stories favour fixed-supply assets. Crypto-native analysts have made this case repeatedly and it is not wrong in principle.
The difficulty is sequencing. When long-end bond markets sell off disorderly, liquidity drains before narratives assert themselves. Margin gets called, allocators raise cash, correlations converge toward one, and the liquid volatile assets go first. Bitcoin has repeatedly been among them, and today’s break fits that pattern rather than the hedge one.
Both readings can hold across different horizons. Weeks of tightening favour the opportunity-cost story. Years of fiscal deterioration favour the debasement story. A trader positioned for the second while the first plays out gets the thesis right and the timing wrong, which in a leveraged market produces the same outcome as being wrong.
What Crypto Traders Should Watch
Three signals matter from here, each hitting a different part of the market.
The first is whether Washington actually intervenes. Another yen spike would force more investors to close positions they funded with cheap Japanese loans, and crypto usually takes the hit early. It trades every hour of every day, so selling can start immediately, while an investor wanting to sell stocks or bonds has to wait for those markets to open. Smaller coins suffer most, because there are fewer buyers waiting and the same amount of selling pushes prices down further.
The second is September 16. FedWatch prices a Fed hike at roughly 65%, and on Yardeni’s logic the effect is not the simple one crypto usually assumes. Higher short-term rates make borrowing to trade more expensive, which traders feel in days through the funding costs on leveraged positions. Any relief at the long end works far more slowly and reaches large investors rather than traders.
The third is 5.396%, the monthly high from June 2007. Clearing it would put the long bond at levels unseen since 2024, and the damage there comes from investors quietly reallocating rather than being forced out. Pension funds and asset managers reviewing where to put money, against a safe return that keeps rising, are what turns into ETF outflows over the following months.
Two of those three depend on decisions taken in Tokyo and Washington. The levels that matter for Bitcoin in August are being set by people who are not thinking about Bitcoin at all.
- Disclaimer: This article reflects market conditions as of Friday, July 31, 2026 and is for informational purposes only. It does not constitute financial or investment advice. Currency intervention decisions can change conditions rapidly, and historical correlations do not guarantee future outcomes.
- Methodology: Bitcoin and CMC20 prices are from CoinMarketCap. Yield figures come from the monthly US30Y and daily US02Y charts on TradingView. Yen movement is from JPY/USD daily and five-day charts. Rate-hike probabilities are from CME FedWatch, the July 9 auction result from Bloomberg, debt figures from the US Debt Clock, and the Treasury notice from Reuters via Yahoo Finance. Cycle-model references are from CryptoQuant contributor Rei Researcher and Glassnode, both published July 31. Ed Yardeni’s bond vigilante framing is his own analytical view.

Alex is Editor-in-Chief of Coindoo and co-founder of Millennial Media Group, with nearly a decade of experience covering financial markets – crypto first, then everything else.
It started in 2016 with Bitcoin. Like most people at the time, he didn’t fully understand it – so he kept digging. Blockchain, tokenomics, the projects, the cycles. That curiosity never stopped, and eventually pulled him into traditional markets too: equities, commodities, macro. Not because he left crypto behind, but because you can’t properly understand one without the other.
What drives him is straightforward: he wants to know why something is happening, not just that it’s happening. Most market coverage stops at the headline – price up, price down, here’s a chart. Alex finds that kind of reporting actively unhelpful. If you walk away from an article without understanding the mechanism behind the move, what did you actually learn?
He holds a degree in Tourism from New Bulgarian University – not the most obvious path into financial markets, but markets have a way of pulling in people who are simply too curious to stay out. He has authored over 200 in-depth analyses and more than 10,000 articles across crypto and traditional finance. He still thinks every day in markets teaches him something new. That’s probably why he hasn’t stopped.



Be the first to comment