



XRP has undercut the $1.31 level needed for its current correction, leaving room for a rebound without necessarily sweeping the $1.25 support.
XRP has reached a support area where its current correction could begin to turn higher without first falling all the way to $1.25.
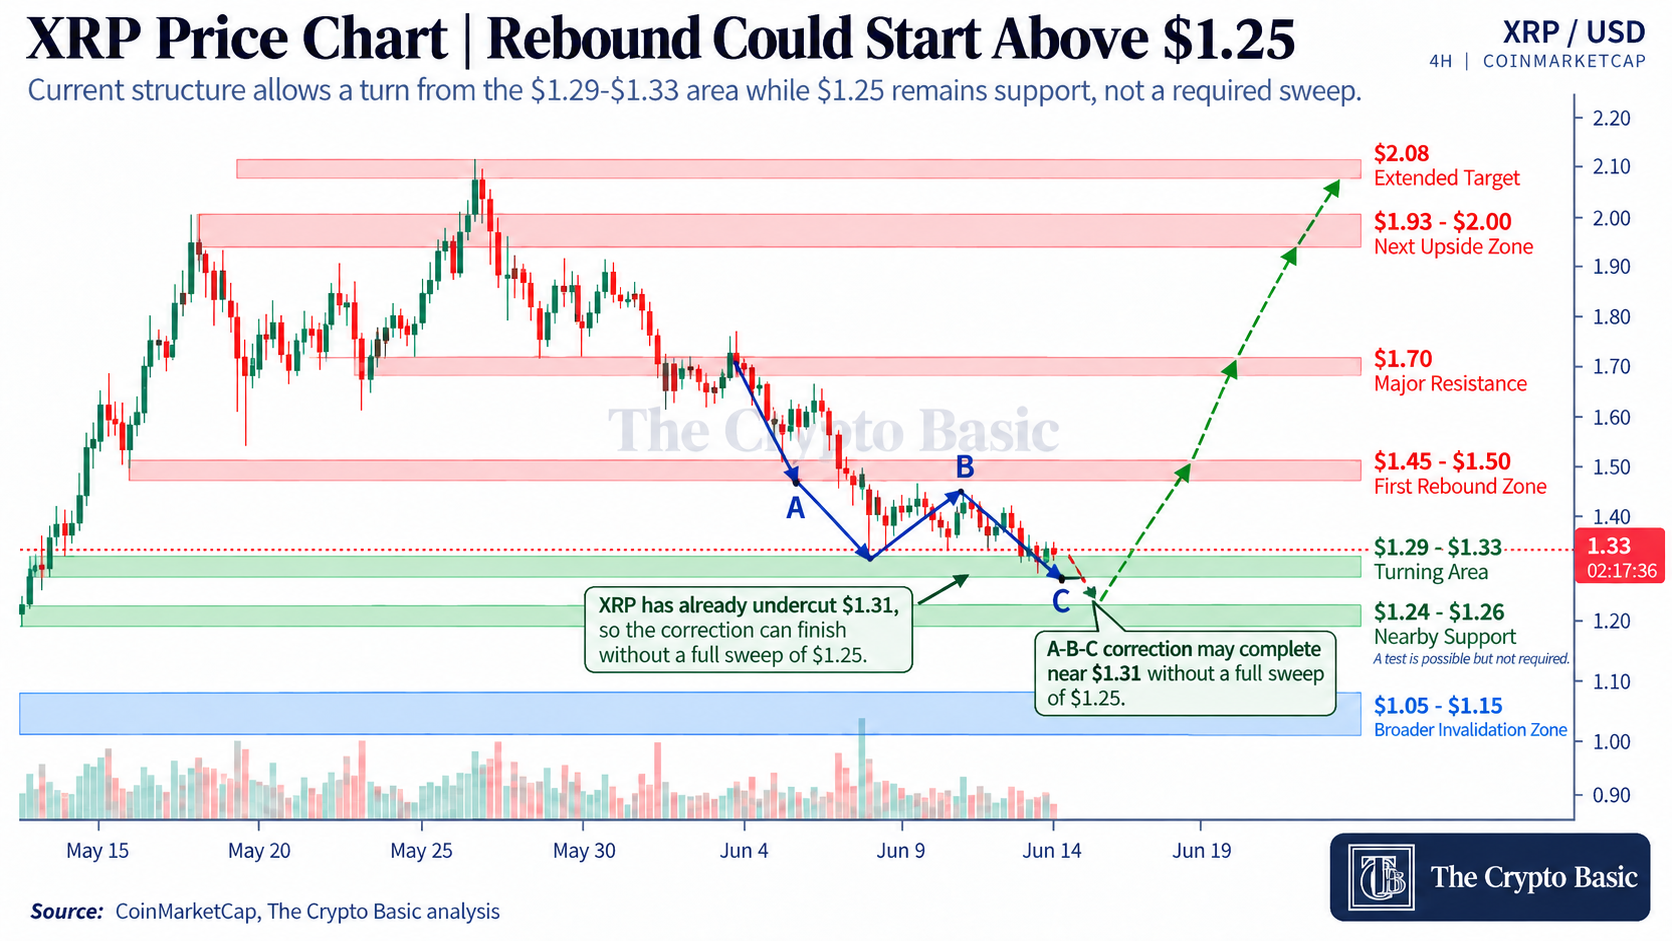
The setup centers on the recent $1.31 low: under one Elliott Wave interpretation, XRP only needs to move beneath that earlier low to complete the final leg of the correction before attempting another advance.
XRP currently trades near $1.33, according to CoinMarketCap, after reaching a 24-hour low around $1.29. That means price has already traded beneath the $1.31 reference level highlighted in the structure.

The question now is whether that undercut was enough—or whether sellers will continue pressing XRP deeper into the support zone.
Why $1.31 Could Mark the Turning Area
The current decline is being treated as an A-B-C correction.
The important detail is the shape of the B-wave. If that wave developed as a flat containing an “unorthodox low,” the final C-wave does not necessarily need to produce a dramatic new low.
It may only need to push beneath the earlier A-wave low around $1.31 before the corrective sequence can finish.
XRP has now done that intraday.
With price recovering toward $1.33 after dipping below $1.31, the market is already testing whether buyers will defend this portion of the structure.
That gives the current area more technical significance than a simple horizontal support.
XRP Does Not Have to Touch $1.25
The chart also marks a broader white demand zone below current price, extending roughly through the upper-$1.20s toward $1.25.
That area remains available if the correction stretches further, but the wave interpretation does not require XRP to sweep $1.25 before rebounding.
From $1.33, a move to $1.25 would represent another decline of roughly 6%.
This distinction matters. The scenario is not that $1.25 cannot break or cannot be tested. Rather, price may already have satisfied the minimum condition for the corrective C-wave by taking out the $1.31 A-wave low.
The next candles need to show whether buyers agree.
A Rebound Would Put $1.50 and $1.70 Back in View
If XRP establishes a floor around the current region, the first meaningful recovery would require a move back toward $1.45-$1.50.
Above that sits the descending resistance line and the former B-wave region. The chart places a larger resistance reference around $1.70, which would need to be cleared before the bullish structure could expand toward higher extensions.
Further levels shown include approximately $1.93-$2.00, followed by the $2.08 area.
Those are later-stage targets and only become relevant if XRP first confirms that the current correction has ended.
From $1.33, a recovery to $1.50 would equal roughly 13%, while $1.70 would require about 28% upside.
Lower Blue Zone Is the Broader Bullish Invalidation Test
The more serious downside risk sits below the white support area.
A larger blue demand zone stretches around roughly $1.05-$1.15 on the chart. This represents the broader support holding the bullish higher-timeframe interpretation together.
A higher-timeframe close beneath that region would undermine the current recovery thesis and increase the risk that XRP returns toward the $0.99 area or produces new lows.
For now, however, XRP is much closer to the first potential turning point.
The $1.31 low has already been undercut, meaning XRP could begin recovering without ever touching $1.25. Whether that happens now depends on buyers turning the current $1.29-$1.33 region into a durable floor.



Be the first to comment