


What to know:
- XRP is forming a tightening triangle pattern, signaling an imminent breakout move.
- Price holds near strong support zones while RSI stays mildly bullish, not overbought.
- MACD crossover and positive histogram suggest a gradually increasing buying momentum.

XRP is starting to exhibit some promising signs of sustained upward momentum by successfully staying above crucial support levels. Based on the technical picture, it suggests that XRP is about to experience consolidation with increased volatility once its direction is firmly established.
At the time of writing, XRP is trading at $1.43, with its 24-hour trading volume being valued at $3.00 billion and market capitalization at around $88.26 billion, based on data from CoinMarketCap. It has gained a moderate increase of roughly 1.41% over the last 24 hours.


Source: CoinMarketCap

Also Read | Ripple Custody Powers Secure Digital Asset Growth for Global Institutions
XRP Technical Pattern Gains Strength
According to a renowned crypto analyst, Ali Martinez, who tweeted on X, XRP is forming a triangle on the hourly chart. This kind of technical formation typically indicates compressed prices in anticipation of a breakout, which can reach up to 10% at maximum, but the trend is yet to be known.
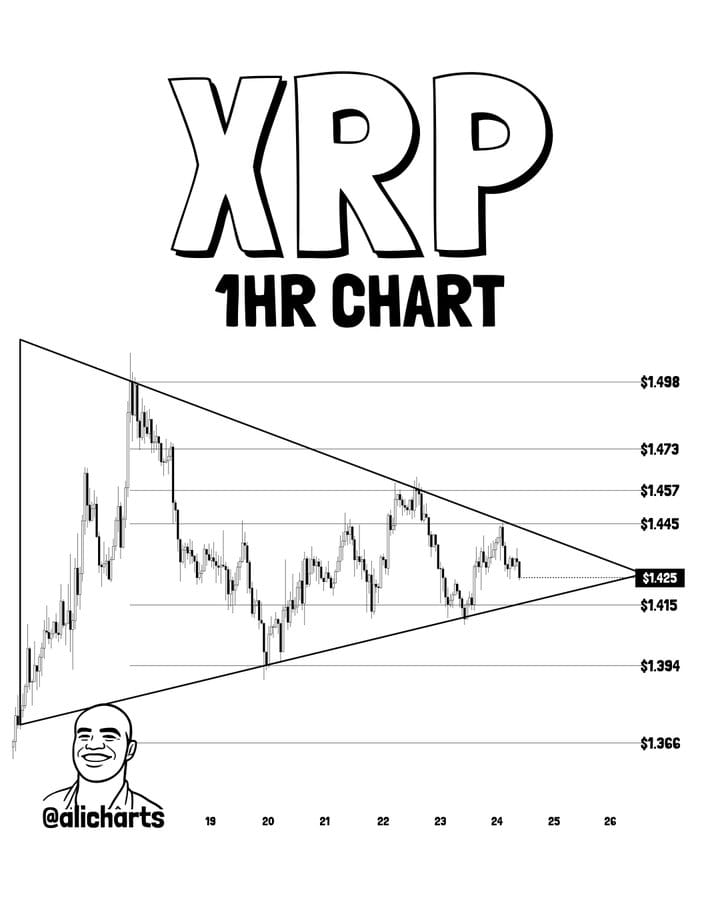

Source: Ali Martinez’s X Post
XRP Shows Early Bullish Strength
Technical analysis of XRP suggests that the cryptocurrency is gaining strength. This can be confirmed by the RSI that has reached 56.24, which is slightly higher than the signal line of 54.66. The fact is that this increase does not put XRP in the overbought area. In addition, the cryptocurrency has found support at $1.3899 and $1.3883.
However, the resistance zones remain intact. The higher moving averages at $1.4895 and $1.8466 are still higher than the current price level, signifying that the overall trend is not yet bullish. If prices begin to rise, these could become important resistance levels.

Source: TradingView
However, momentum indicators have been performing better; this is seen from the MACD line crossing above the signal line and the histogram turning positive. It suggests that there has been a gradual rise in buying activity within the stock market, implying that the stock might be gearing up for bigger directional movement soon.
This article contains market analysis and price predictions. These are not guarantees. Crypto markets are volatile. Always DYOR. Not financial advice.
Also Read | Chainlink Soars Toward $30 Breakout After Powerful Coinbase Data Boost

Be the first to comment