


Zcash’s October outlook hinges on holding $1,250 support and reclaiming $1,500 after a 22% retreat from its September peak.
Summary
- Zcash price traded near $1,320, roughly 22% below its late-September peak near $1,693.
- The daily price fell below the 20-day average but remained above longer-term averages.
- CoinGlass showed liquidation concentrations near $1,270 and $1,165, with additional bands above $1,400.
- Analyst Ardi expects a possible recovery toward $1,420–$1,500 before another decline.
TradingView’s Binance ZEC/USDT daily chart showed Zcash at $1,320.83, down 3.35% for the session. The day’s range stretched from $1,289.54 to $1,370.21, keeping the price close to the lower end of its recent trading range.

The retreat follows a steep September advance that carried ZEC above $1,600. Since that peak, the daily chart has recorded lower rebound highs, with attempts to recover toward $1,400 failing to restore the earlier upward trend.
Zcash loses its 20-day average as momentum weakens
The daily moving-average ribbon places the 20-day simple moving average at $1,457.18, above ZEC’s current price. A return to that level would require a gain of roughly 10%, making it an immediate recovery hurdle.
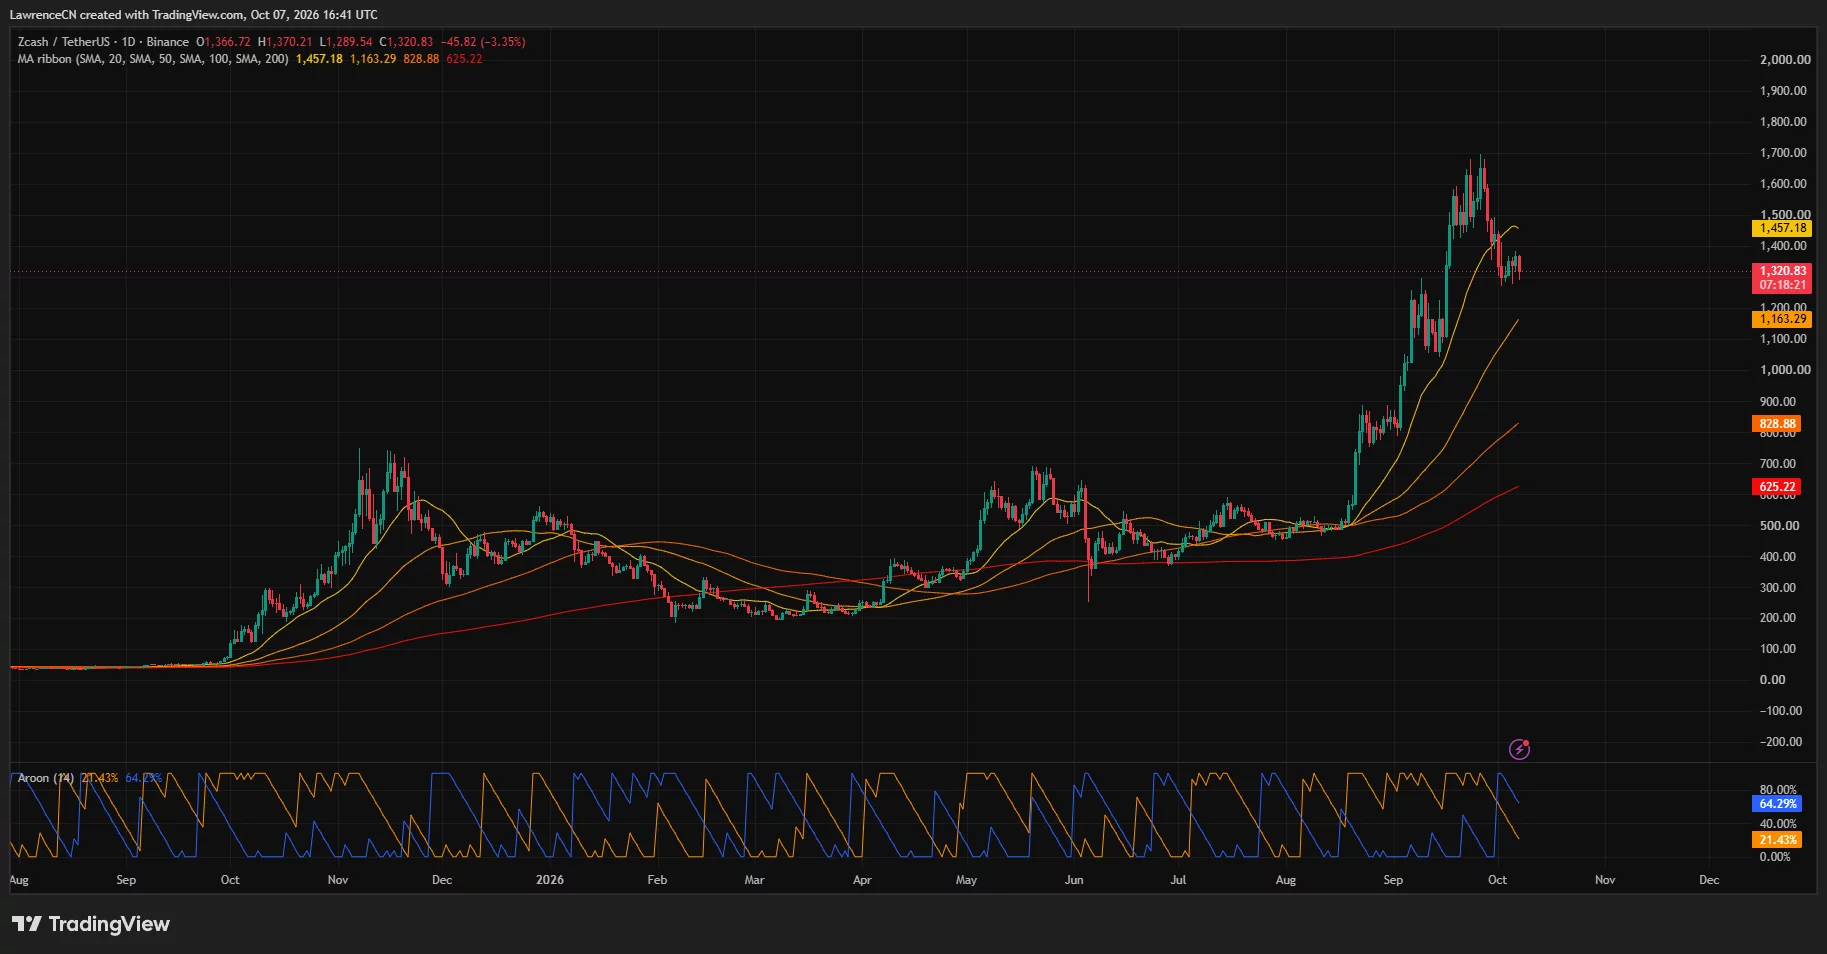
Zcash remained above its 50-day average at $1,163.29, its 100-day average at $828.88 and its 200-day average at $625.22. The averages were still arranged from shortest to longest in descending price order, preserving the broader bullish alignment despite the recent pullback.
The daily chart therefore shows two different conditions: price has broken below its nearest trend measure, while the longer-term averages remain well beneath the market. A recovery above $1,457 would repair part of the short-term damage; a decline toward $1,163 would test the next major moving average.
The Aroon indicator also showed weaker upward momentum. Aroon Up stood at 21.43%, compared with Aroon Down at 64.29%, indicating that the latest lows were more recent than the latest highs within its measurement period.
The weekly chart placed ZEC at $1,316.17, with a weekly high of $1,385 and a low of $1,278. Its Bull Bear Power reading remained positive at 567.48, although the histogram had declined from its recent peak.
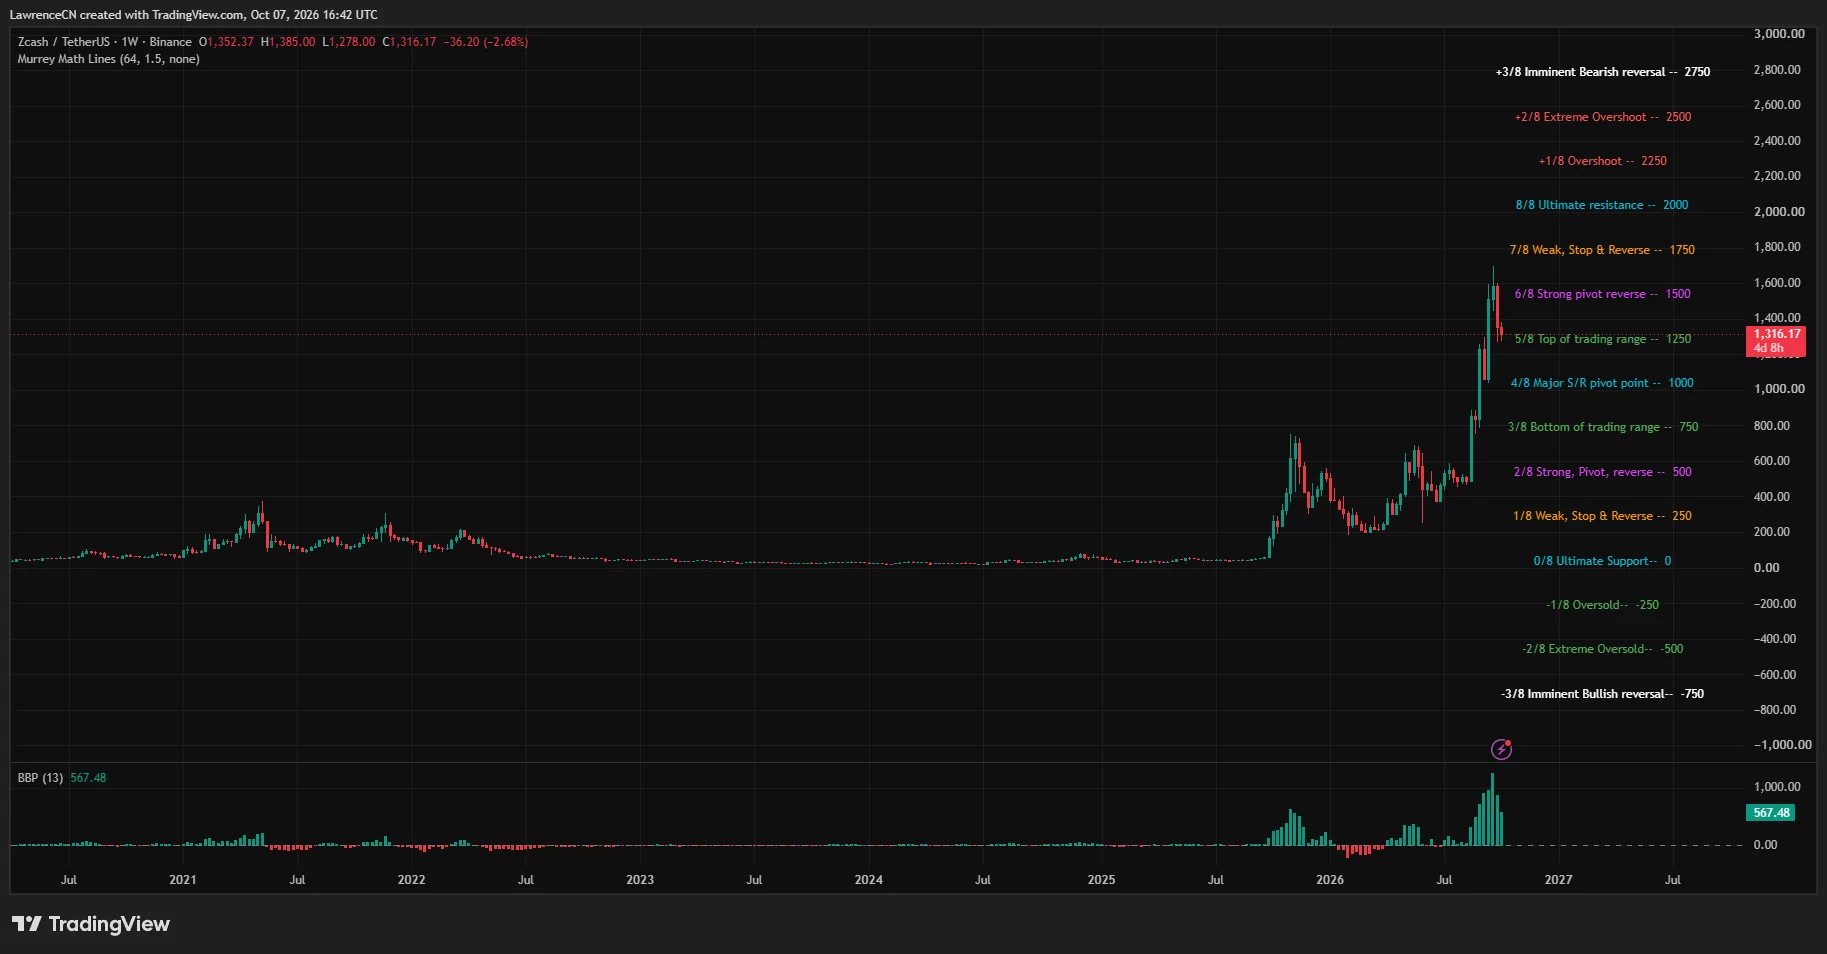
Together, the daily and weekly readings support a conditional October outlook: the longer trend remains elevated, but buyers have yet to reverse the latest decline.
A rebound toward $1,500 could face another rejection
Crypto analyst Ardi said Zcash had lost a daily swing low for the first time since trading in the $400 range. He also identified broken support on the ZEC/BTC pair across several timeframes.
Ardi expects a stronger Bitcoin rally could lift ZEC toward the previous distribution area between $1,420 and $1,500. His forecast treats that move as a possible lower high rather than an immediate return to September’s peak.
“In that case, I’d expect a lower high to form before another leg down towards the liquidity in the previous range at $1,100–$1,200.”
That recovery zone overlaps the daily 20-day average near $1,457. The weekly Murrey Math overlay also marks $1,500 as a pivot, giving the area relevance across both charts.
For the bullish October scenario, ZEC would first need to regain nearby prices around $1,370–$1,400, then hold above the $1,420–$1,500 region. Sustained trading above that band would challenge Ardi’s lower-high forecast and put the September peak near $1,693 back in view.
The weekly overlay places its next upper level at $1,750. Reaching it would require Zcash to recover the September high first, making it a further upside scenario rather than the nearest target.
Ardi’s downside case also depends on Bitcoin. He expects ZEC could fall toward the lower range without a rebound if Bitcoin loses its own trading range.
Liquidation clusters put $1,270 and $1,165 in focus
CoinGlass’s one-month liquidation heatmap showed a bright concentration near $1,270, beneath ZEC’s current price. Another prominent band sat around $1,165, close to the daily 50-day average.
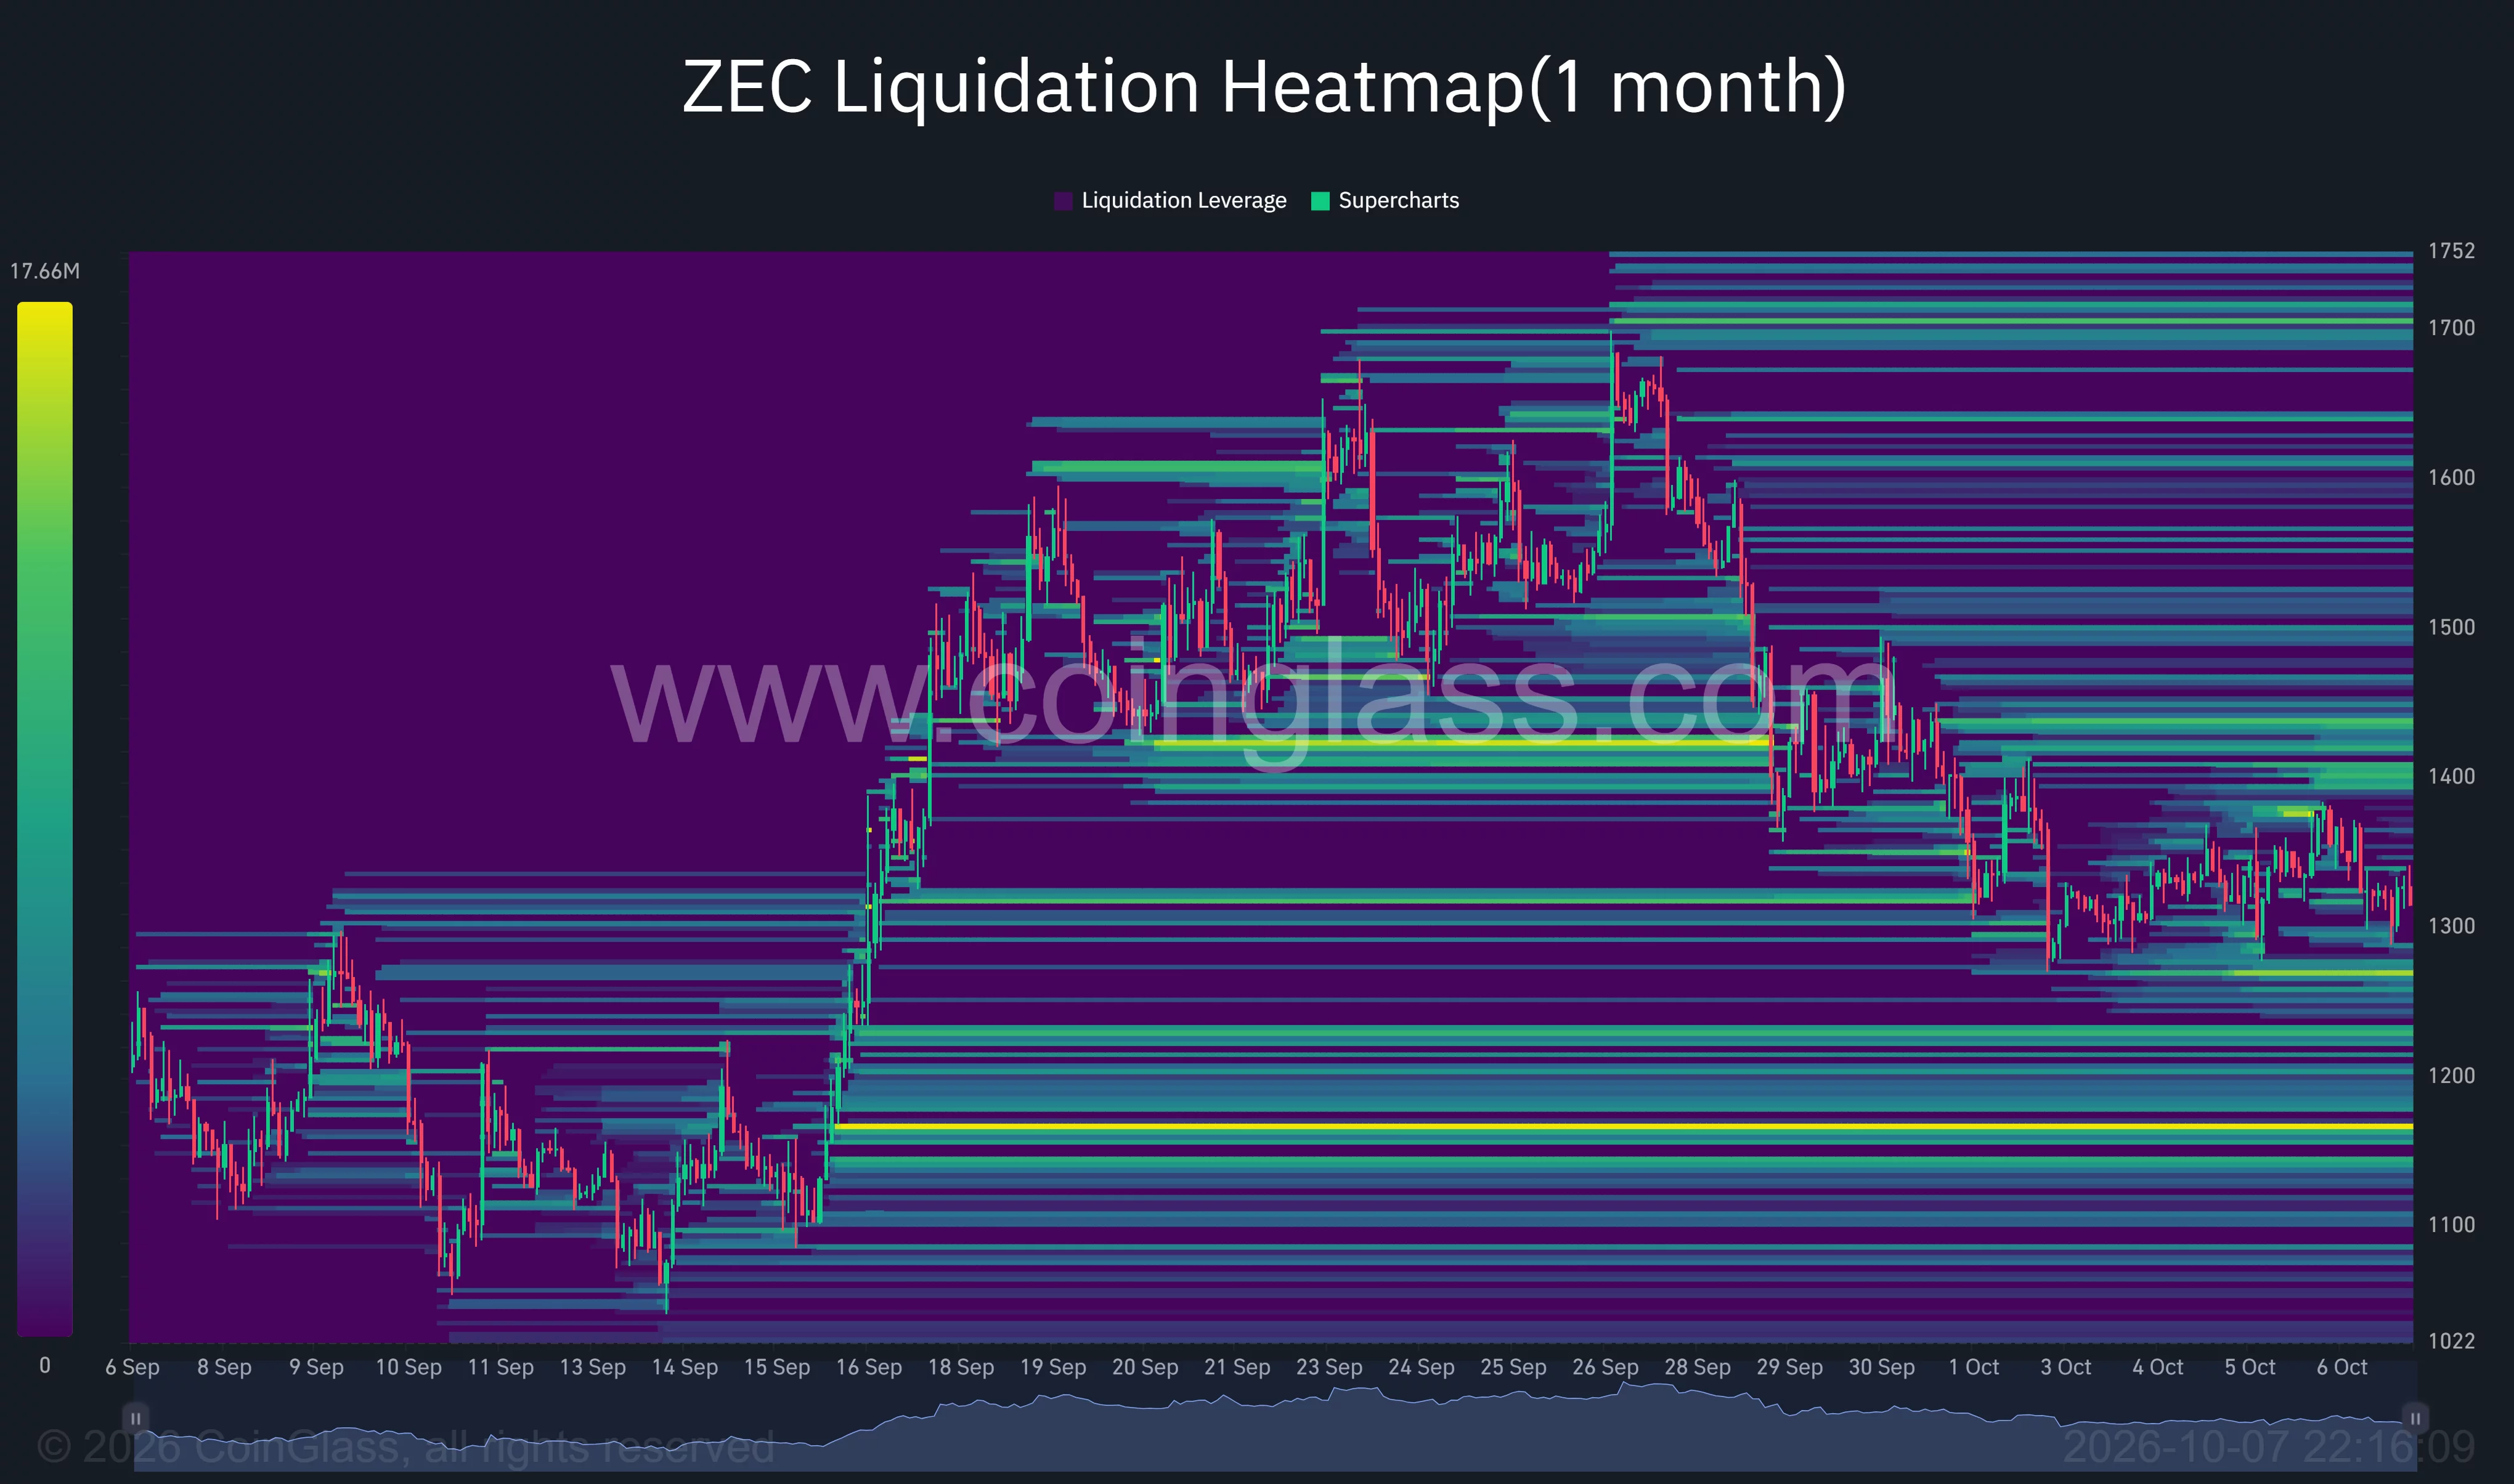
The weekly chart adds a separate reference at $1,250 through its Murrey Math trading-range level. Alongside the recent weekly low of $1,278, those readings place the nearest downside test around $1,250–$1,300.
A sustained break below that area would leave the $1,165 region as the next chart-based reference. Ardi’s projected $1,100–$1,200 range includes that moving-average and liquidation cluster.
Above the market, CoinGlass showed additional concentrations around $1,400–$1,440 and near $1,500. Those bands overlap the recovery area identified by Ardi, while further clusters extend toward $1,600–$1,700.
Altcoin Sherpa offered a more constructive view in an Oct. 7 post. The analyst said the current area should hold and described ZEC as one of the stronger altcoins by relative strength.
He identified $1,200 or lower as an area of interest, but tied that possibility to Bitcoin falling toward $80,000. His outlook and Ardi’s forecast both make Bitcoin’s direction a central condition for Zcash’s next move.
US ETF access remains part of Zcash’s market backdrop
Grayscale said its Zcash exchange-traded product, ZCSH, began trading on NYSE Arca on Aug. 25. By Sep. 8, assets under management exceeded $500 million, including a roughly $100 million contribution from a Digital Currency Group affiliate and more than $70 million in cumulative inflows since launch.
A separate SEC filing scheduled a 3-for-1 share split to take effect before trading opened on Sep. 30. The filing stated that the split would reduce the price and net asset value per share proportionately while increasing the number of shares outstanding.
For October, the chart-based outlook centers on whether ZEC holds $1,250–$1,300 and recovers $1,420–$1,500. A rejection from the upper band would remain consistent with Ardi’s forecast toward $1,100–$1,200; a sustained reclaim would strengthen the case for a return toward September’s peak.
Disclosure: This article does not represent investment advice. The content and materials featured on this page are for educational purposes only.


Be the first to comment