



Key Insights
- Bitcoin (BTC) price crossed $79,000 as forced short liquidations accelerated.
- BTC cleared prior resistance while on-chain supply remained thin overhead.
- CryptoQuant’s Bull Score returned to bullish territory above 60.
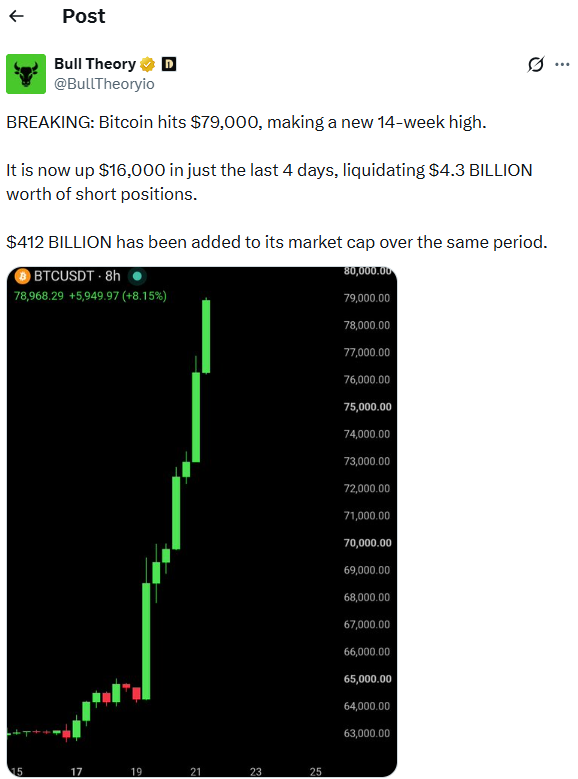
Bitcoin price broke above $79,000 on August 21 after extending a four-day recovery. CoinMarketCap data showed Bitcoin later traded near $77,000, with a slight pullback from its daily high.
The breakout pushed BTC through several resistance levels established during its previous decline. It also forced leveraged bearish traders to exit positions as spot demand improved.
Bitcoin Price Rises as Shorts Unwind
CoinMarketCap showed the BTC price near $77,000 on Aug. 21. BTC price gained roughly 7% over 24 hours, with trading volume exceeding $70 billion.
Historical CoinMarketCap data placed Bitcoin near $62,819 on Aug. 16, while subsequently trading above $69,000 on Aug. 19 before extending the advance.

The move represented a sharp reversal after several weeks of weak market structure. Bull Theory said Bitcoin had gained about $14,000 from roughly $62,700 during the rebound.
The market account also attributed part of the acceleration to short liquidations. It estimated traders had lost about $4 billion across bearish positions during four days.
Separate derivatives data supported evidence of heavy forced buying. CoinGlass data showed $865.38 million in Bitcoin liquidations during one recent session.
Short positions accounted for $742.28 million of that total, the CoinGlass figures showed. Forced short closures can generate additional market purchases when exchanges liquidate bearish leveraged positions.
Bitcoin (BTC) Price Clears Key Technical Resistance
That Martini Guy said BTC had cleared resistance near $70,500 before reaching about $75,743. He identified the former resistance level as the next area buyers had to defend.
That structure placed Bitcoin above a zone that had previously restricted upside moves. However, maintaining the breakout remained necessary before traders could treat $70,500 as established support.
On-chain analyst Ali Martinez identified another technical threshold slightly above $75,700. His analysis used Unspent Transaction Output Realized Price Distribution data to locate historical Bitcoin transaction clusters.
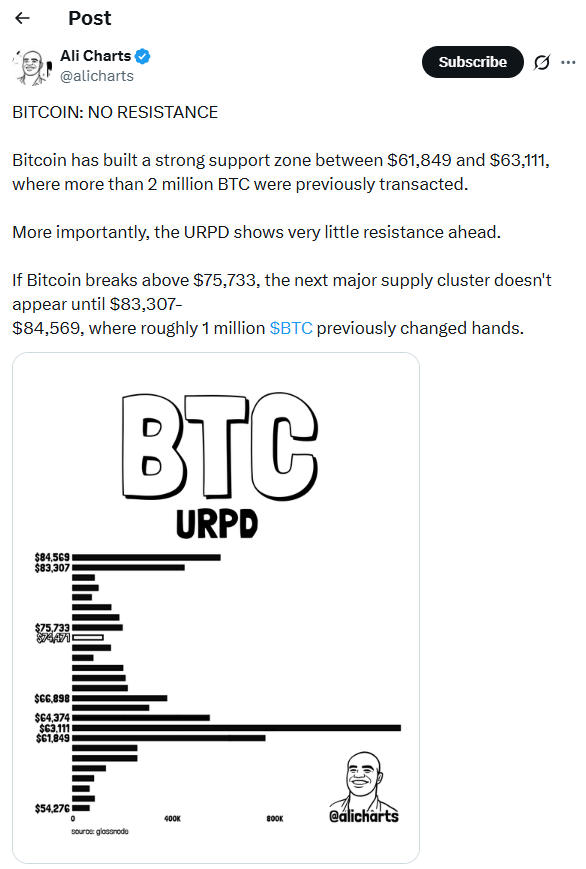
Martinez said more than two million BTC previously moved between $61,849 and $63,111. That transaction concentration created a large on-chain support area below current prices.
His data showed comparatively little historical supply immediately above the breakout area. The next larger supply cluster appeared between $83,307 and $84,569.
Crypto Patel identified $82,800 as another level requiring confirmation. The trader argued that holding above it could expose the psychological $100,000 area.
He also identified a fair-value gap between $65,000 and $69,000 below current prices. A breakdown would therefore weaken the present breakout structure.
Meanwhile, investors should note that this article provides market analysis based on technical indicators and is not intended to provide investment or financial advice. The price targets and levels discussed may not materialize, as cryptocurrency markets are highly volatile and influenced by numerous factors.
Investors should independently assess the risks and seek professional advice where appropriate.
BTC Price Gets On-Chain Support
CryptoQuant analyst Darkfost reported that the Bitcoin Bull Score crossed 60 on Aug. 21. The reading marked its first return to bullish territory since October 2025.

The CryptoQuant metric combines several market indicators to classify broader Bitcoin conditions. Darkfost said six of its ten underlying indicators had turned positive.
Those components included demand growth, stablecoin liquidity and trader realized price. The combination suggested the rally had gained support beyond short liquidations alone.
Darkfost also noted an important historical comparison. Bitcoin had climbed above $82,000 in May without pushing the Bull Score into bullish territory.
The latest move therefore showed broader improvement across CryptoQuant’s tracked indicators. However, the researcher said the score would have to remain above 60.
That distinction matters because liquidation-driven rallies can weaken after forced buying subsides. Persistent spot demand would offer stronger evidence that buyers remained active afterward.
CoinMarketCap data placed the next immediate test around the latest intraday highs near $77,000. Martinez’s on-chain analysis placed the larger supply barrier between $83,307 and $84,569.
A sustained move through that zone would reduce nearby historical supply resistance. Losing $70,500 would instead put the breakout structure identified by That Martini Guy under pressure.


Be the first to comment