



Bitcoin price is nearing the $80,000 level after witnessing a sharp breakout in price action. The current market readings show that the derivatives traders are playing a larger role in this price action compared to spot buyers.
Bitcoin price is currently trading at $79,256, representing a gain of 0.29% over the past 24 hours. The rise keeps BTC above its recent consolidation range; but then again, with strong momentum and flat spot demand, the upcoming resistance area might prove to be very crucial.
Also Read: Bitcoin Price Faces $83,000 Resistance as $50,000–$55,000 Target Returns to Focus
What Does the Bitcoin Price Chart Show?
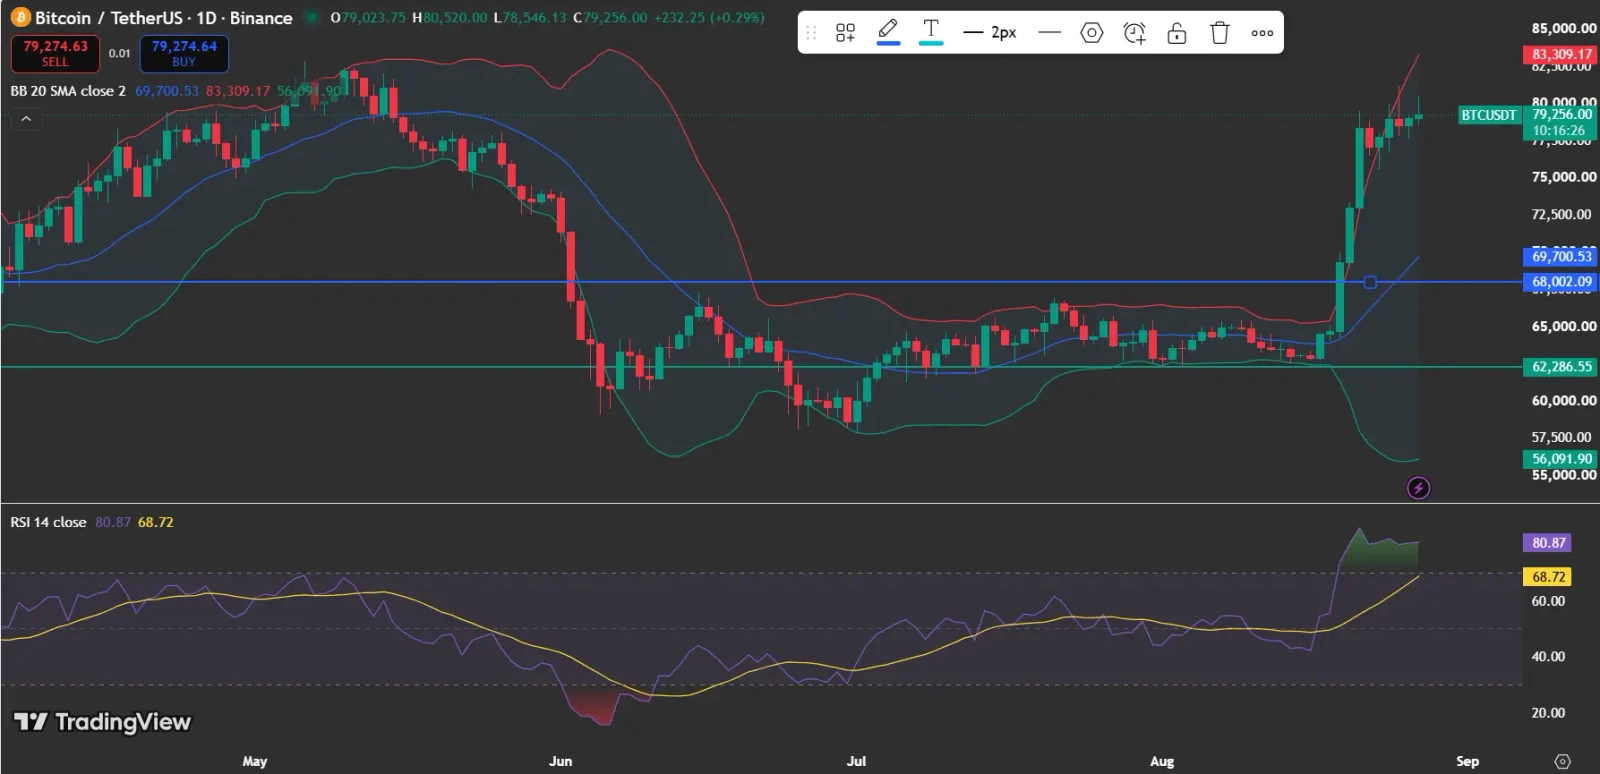
According to the TradingView chart, Bitcoin has broken above the critical resistance level of $68,002 and is currently moving closer to $79,256.

The breakout has caused BTC to move toward the upper Bollinger Band of $83,309, with the middle band being at $69,700. Therefore, it is evident that the current setup on the charts is a bullish one.
Relative Strength Index (RSI) has risen to 80.87, crossing the typical overbought level of 70. It shows that the strength of the move has been strong, but a correction may come soon because of that.
Why Is the Bitcoin Price Going Up Without Increased Demand?
In an X post from Ted Pillows, one of the key factors at play is highlighted in “Price Up. Demand Flat.”
The post suggests that the rise in BTC is being caused by perpetual futures (perps) and not spot, meaning that the rise is being influenced more by perpetual futures than spot markets.
The post specifically points to BTC being “pushed higher by perps and not spot.” This is an important factor since a derivatives-driven rally can lead to very fast increases.
However, at the same time, the same rally can be accompanied by increased volatility when the leveraged positions start unwinding.
How Does Open Interest Affect Bitcoin Price?
As noted by CoinGlass, open interest of Bitcoin grew significantly during the latest uptrend, reaching approximately $55 billion on August 26.
The simultaneous growth in price and open interest suggests increased market activity in the derivatives segment.
The above information is in line with the note in the X post on how perpetual futures are driving the price movement currently. Instead of disproving the bullish scenario, the current data shows where the momentum is coming from.
Also Read: Bitcoin Price Nears $80K as ETF Inflows and Open Interest Surge
Will Bitcoin Price Hit $83K Next?
The next important upside level is the upper Bollinger Band at $83,309. According to CoinCodex predictions, Bitcoin is expected to reach $80,307 on August 28 and $83,361 on August 31.
The data from Cryptorank also shows 26.7% monthly gain in August shows strong current momentum.
What Should Bitcoin Price Traders Watch Next?
According to SoSoValue, Bitcoin ETFs recorded $232.12 million in inflows on August 26, taking cumulative inflows to $54.59 billion.
As open interest continues to grow alongside the derivatives-led rally, traders will watch whether BTC can break above $83,309 and attract stronger spot buying pressure.
Also Read: Bitcoin Price Hits $80,000 After 28% Surge as $100,000 Target Returns
This article contains market analysis and price predictions. These are not guarantees. Crypto markets are volatile. Always DYOR. Not financial advice.



Be the first to comment