


What to know:
- BONK price approaches key resistance within a falling wedge pattern, signaling a potential bullish breakout and trend reversal.
- Open interest surges by 19%, highlighting increased trader confidence and growing speculative activity in BONK.
- Technical indicators like RSI and MACD show neutral-to-bullish momentum, indicating possible upside continuation.

Bonk (BONK) is showing signs of bullish momentum as the token approaches the upper boundary of the falling wedge pattern. Furthermore, LUNC derivative data point to a bullish outlook with increasing open interest. According to CoinMarketCap, LUNC is currently trading at $0.000006467, with a 24-hour gain of 3.7%.
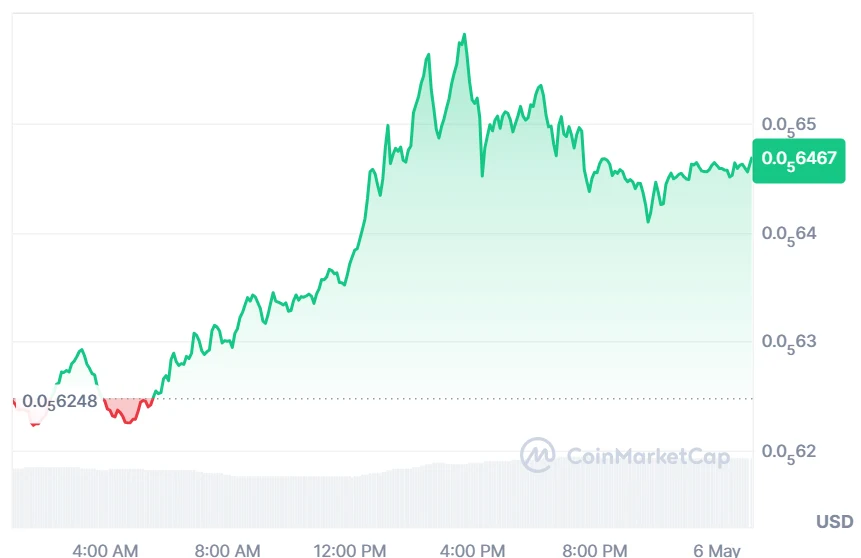

Source: CoinMarketCap
BONK Rising Open Interest Point to Bullish Outlook
According to Coinglass, the BONK open interest increased by 19.26%, reaching $7.46 million. This reflects growing trader engagement and stronger market positioning, indicating rising commitments and heightened speculative activity compared to earlier trading conditions.


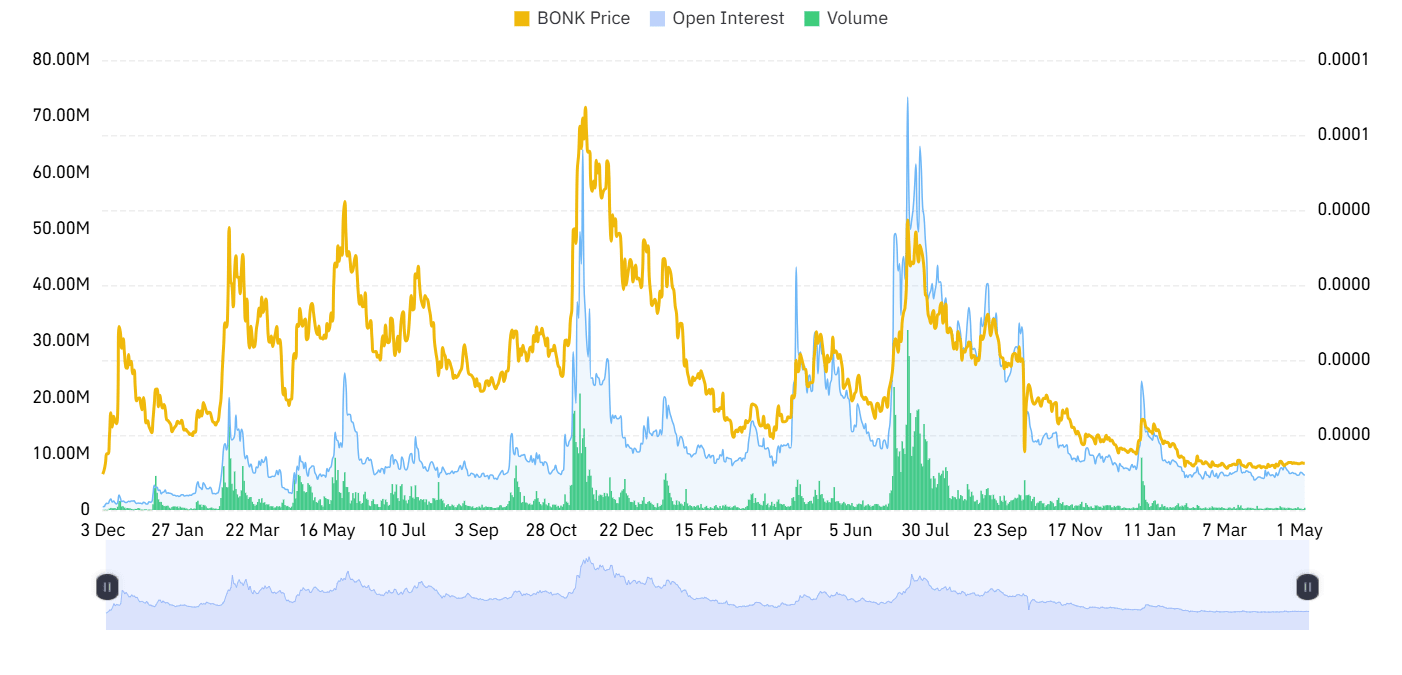
Source: Coinglass
However, trading volume shows a decline of 7.87%, currently standing at $14.29 million. This indicates reduced market activity compared to the previous period, suggesting weaker participation and lower turnover in recent trading sessions.
Also Read: BONK Breakout Could Reach $0.0000260 Target if Resistance Holds
BONK Price Setup Hints at Major Upside Breakout
Furthermore, the crypto analyst Jonathan Carter pointed out that BONK is showing a potential technical shift as it consolidates just below the upper boundary of a descending channel on the 2-day chart.
This compression suggests weakening selling pressure and possible accumulation. Traders are watching closely, as a breakout above resistance could signal the start of a new upward trend phase.

Source: Jonathan Carter’s X Post
In case of breakout confirmation, the momentum may carry prices towards successive targets of $0.0000075, $0.0000090, $0.0000120, $0.0000170, and $0.0000260.
The traders are looking forward to seeing significant volumes along with a confirmation candle on the chart. A rejection could lead the price to the lower boundary of the wedge.
Momentum Indicators Point to Increasing Strength
According to TradingView, the BONK price movement is now confined within tight ranges following a previous period of volatility.
New candles have been seen to form at a very low level of about 0.00001. There is no apparent direction in the movement of prices. Short trades are being made, but there is no clear advantage for either bulls or bears.

Source: TradingView
The momentum indicators support an attitude that is slightly bullish or at least neutral. The MACD remains at zero with histogram bars that are nearly flat, indicating low momentum and no clear direction of the trend.
The RSI is located at mid-to-higher levels, somewhere in the 50s to almost 60, reflecting moderate bullishness but not being overbought.
This article contains market analysis and price predictions. These are not guarantees. Crypto markets are volatile. Always DYOR. Not financial advice.
Also Read: BONK Could Surge to $0.00001050 After the Rounded Bottom Formation

Be the first to comment