


Although recent market data indicates that short-term conditions may be worsening, Hyperliquid continues to be one of the best-performing assets of the current market cycle. Liquidity metrics are showing red flags that traders shouldn’t ignore, even though HYPE is still trading well above its major moving averages and maintaining a strong long-term uptrend. The sharp decline in futures liquidity flows is among the most noteworthy developments.
According to recent data, losses in net futures liquidity can reach 1,700% over shorter time periods. Futures outflows surpassed inflows by approximately $17.6 million during the four-hour window alone, and several shorter intervals showed similarly aggressive capital withdrawal patterns. This is important because strong rallies are frequently fueled by liquidity. Momentum can rapidly wane when inflows start to decline while traders withdraw money from derivatives markets concurrently.
Since HYPE’s dominance in perpetual futures trading has contributed significantly to its valuation growth, the situation becomes especially significant. The figures show conflicting results. The fact that open interest is still high at $2.8 billion indicates that traders are still very interested in the asset. Binance accounts continue to have a slight bullish bias and long-short ratios are likewise comparatively balanced. But data on futures flows tells a different tale.

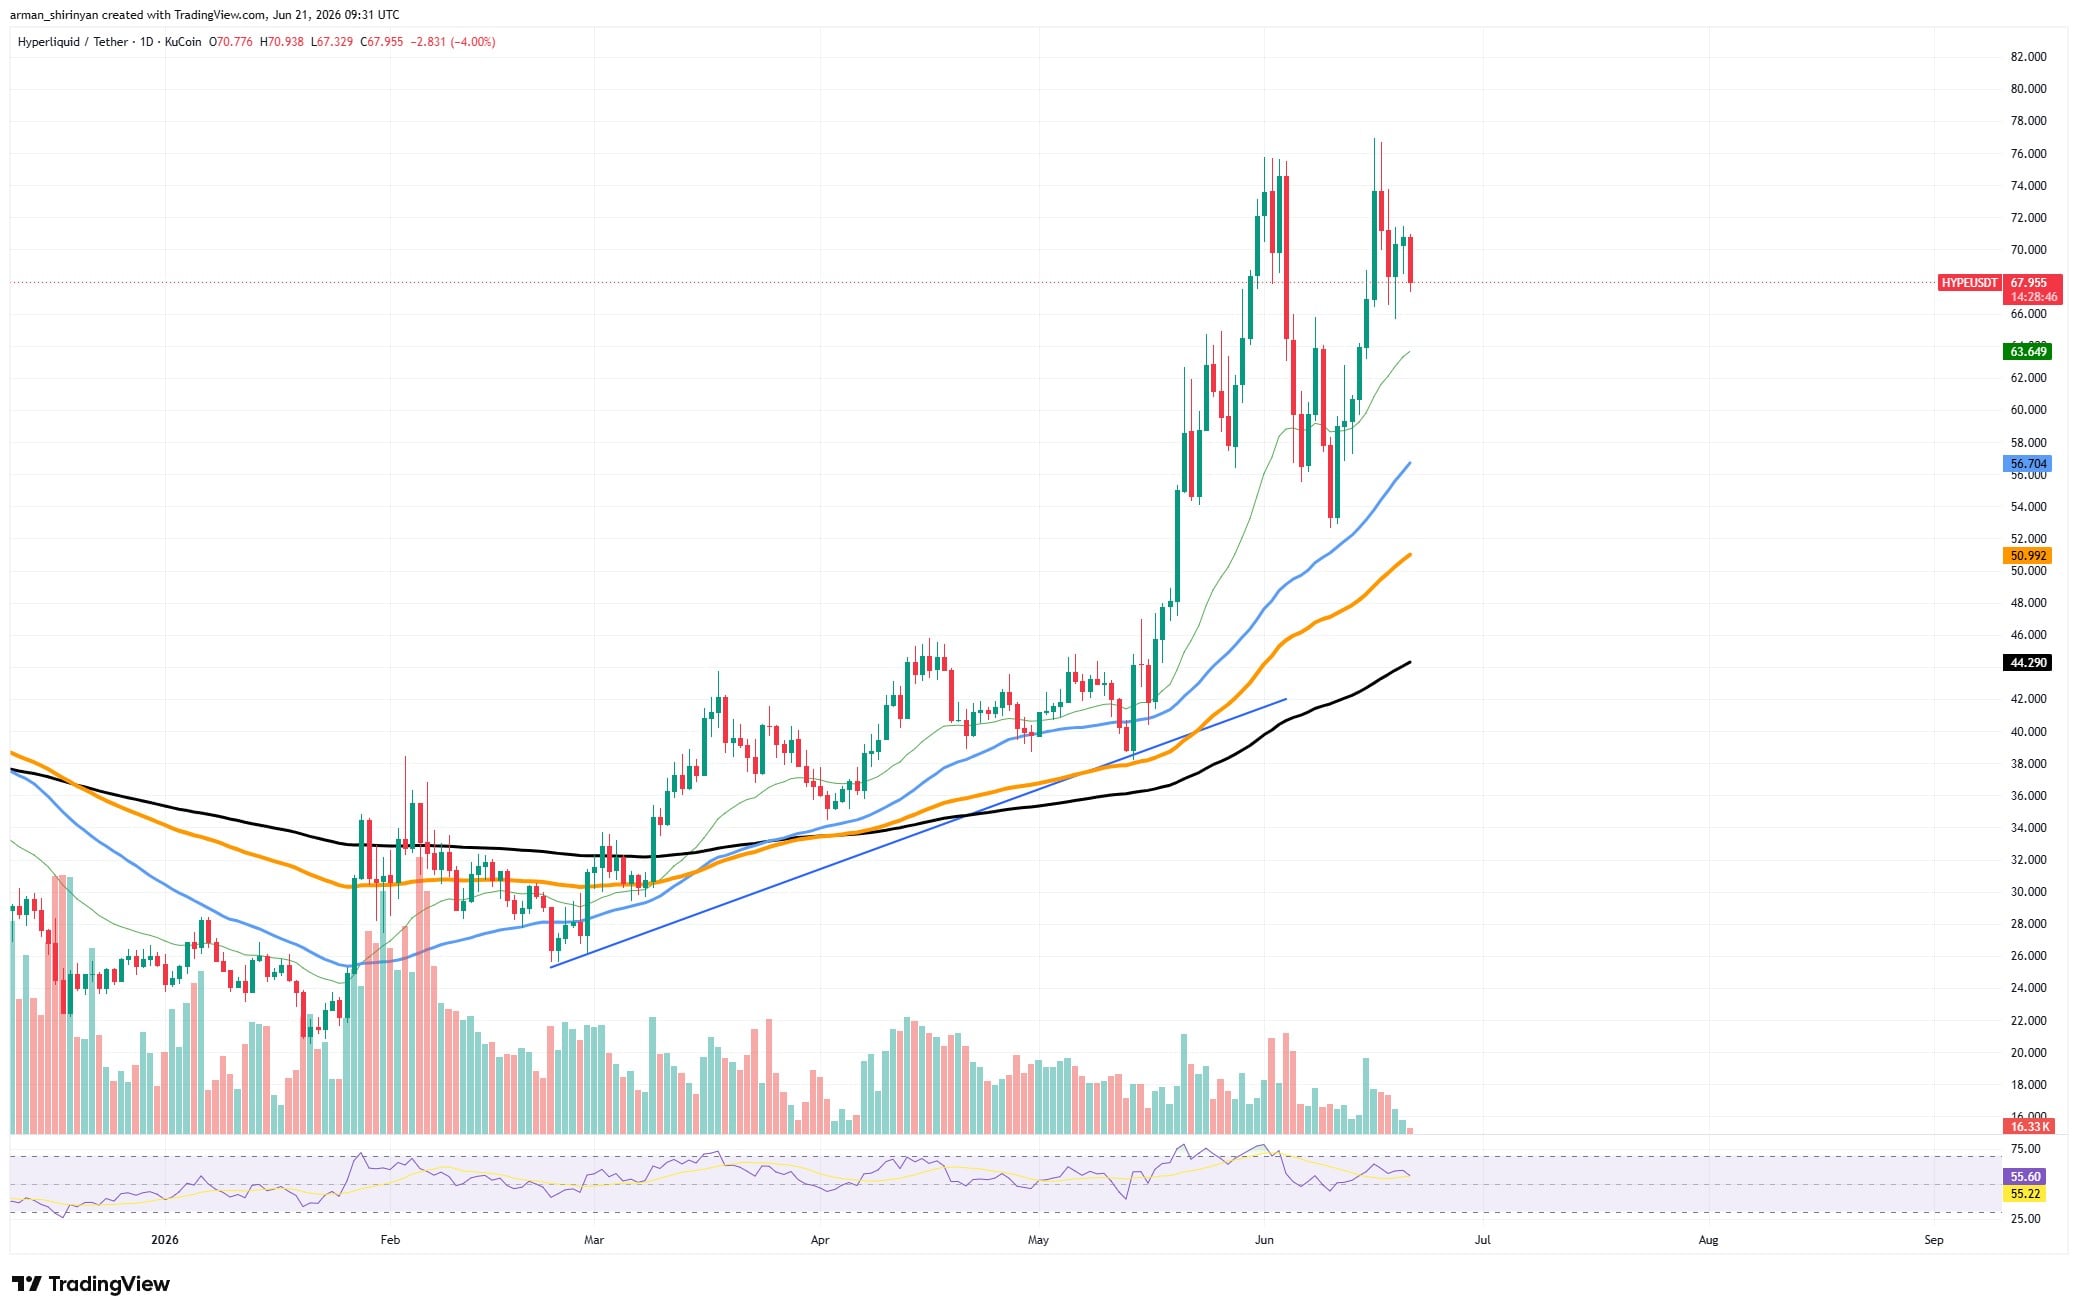
After HYPE’s massive rally in recent months, almost every tracked timeframe currently exhibits net negative flows, indicating that market participants are growing more cautious. That uncertainty is reflected in the chart. After rejecting the $75–$76 range for the second time, HYPE is currently in a consolidation phase around $68.
You Might Also Like

Momentum has obviously decreased even though the asset is still comfortably above its 50-, 100-, and 200-day moving averages. The market is no longer experiencing the same euphoric conditions that drove the previous breakout, as evidenced by the RSI’s retreat from overbought territory. Crucially, none of this necessarily means that the wider uptrend is coming to an end. In actuality, liquidity frequently leaves the market before a new phase of accumulation starts in strong bull markets.
Whether buyers come back before important support levels break is the crucial distinction. The $63–$64 range is still the first significant support zone as of right now. A deeper correction toward the 100-day moving average, which is close to $56, could be possible if HYPE loses that level.

Be the first to comment