


Injective is approaching $9.36 after a strong weekly advance. Its tokenization pipeline, development activity and revenue-linked token burns give the move a wider context than the price chart alone, but those plans still need to translate into sustained network activity.
INJ traded at $9.16 on Binance’s INJ/USDT daily chart at 10:02 UTC on October 16, up 7.22% on the open daily candle. The session reached $9.36 before pulling back slightly, leaving that new high as the immediate breakout test.
Key Takeaways
- CoinMarketCap ranked INJ sixth among weekly gainers in its top-200 universe.
- Injective’s tokenization pipeline includes Pentiv’s planned mortgage-record migration.
- INJ is testing $9.36, with $8.09 and $7.30 as the first levels below.
- Daily RSI is near 65.5, while the October 16 candle remains open.
INJ’s weekly performance puts the latest rise in context
CoinMarketCap’s October 16 weekly gainers table placed Injective sixth among the top 200 cryptocurrencies by market capitalisation. It showed a seven-day gain of 29.65%, a price of $9.24 and a market value of approximately $923.7 million.
Weekly Top Gainers
1️⃣ Basic Attention Token (@attentiontoken): +75.00%
2️⃣ ZKsync (@zksync): +44.16%
3️⃣ Celestia (@Celestia): +35.57%
4️⃣ Walrus (@walrusprotocol): +32.90%
5️⃣ Sonic (@SonicLabs): +31.39%
6️⃣ Injective (@injective): +29.65%
7️⃣ Reserve Rights (@reserveprotocol): +21.37%
8️⃣ Aerodrome Finance (@aerodromefi): +16.13%
9️⃣ Optimism (@optimism): +12.15%
🔟 EigenCloud (@eigenlayer): +11.74%— CoinMarketCap (@CoinMarketCap) October 16, 2026
The ranking shows that the move extends beyond the current daily candle. CoinMarketCap’s weekly figures and the Binance chart are separate observations: the seven-day return comes from the published table, while the technical levels below are based on the supplied daily chart.
The rally now depends on whether Injective can turn its expanding financial infrastructure into recurring activity and revenue. Its recent announcements point to work in that direction, although announced portfolio values and development rankings are not, by themselves, measures of demand for INJ.
What gives the move context: a growing tokenization pipeline, continued protocol development and a mechanism designed to connect ecosystem revenue with INJ token burns. None of those elements guarantees near-term usage or revenue growth on its own.
Tokenization plans connect expansion to Injective’s revenue model
In an October 15 announcement, Injective said Pentiv plans to tokenize its $10 billion real-estate portfolio and bring agentic operations onchain. Pentiv is the new operating brand of Pineapple Financial, whose mortgage-record migration was already underway before this week.
Pentiv marks a major milestone for institutional adoption on Injective.
Pentiv is set to tokenize its entire $10 Billion real estate portfolio on Injective while also bringing its agentic operations onchain with $INJ
We’re excited for the team’s next chapter.
— Injective 🥷 (@injective) October 15, 2026
Injective’s September update reported more than $1 billion in residential mortgage records on the network. It described digital records linked to underlying loan files, rather than mortgages repackaged into new securities for investors.
The $10 billion figure therefore describes the broader migration ambition, not $10 billion of newly deposited trading liquidity. The commercial opportunity lies in making financial records and related operations usable onchain. Any effect on INJ depends on the activity those services eventually generate.
Injective is also drawing attention to the connection between usage and token economics. Its revenue-to-fully-diluted-valuation comparison, citing Artemis data, placed it first among the platforms displayed. That is a valuation-relative comparison, rather than evidence that Injective generates the highest revenue in absolute dollar terms.
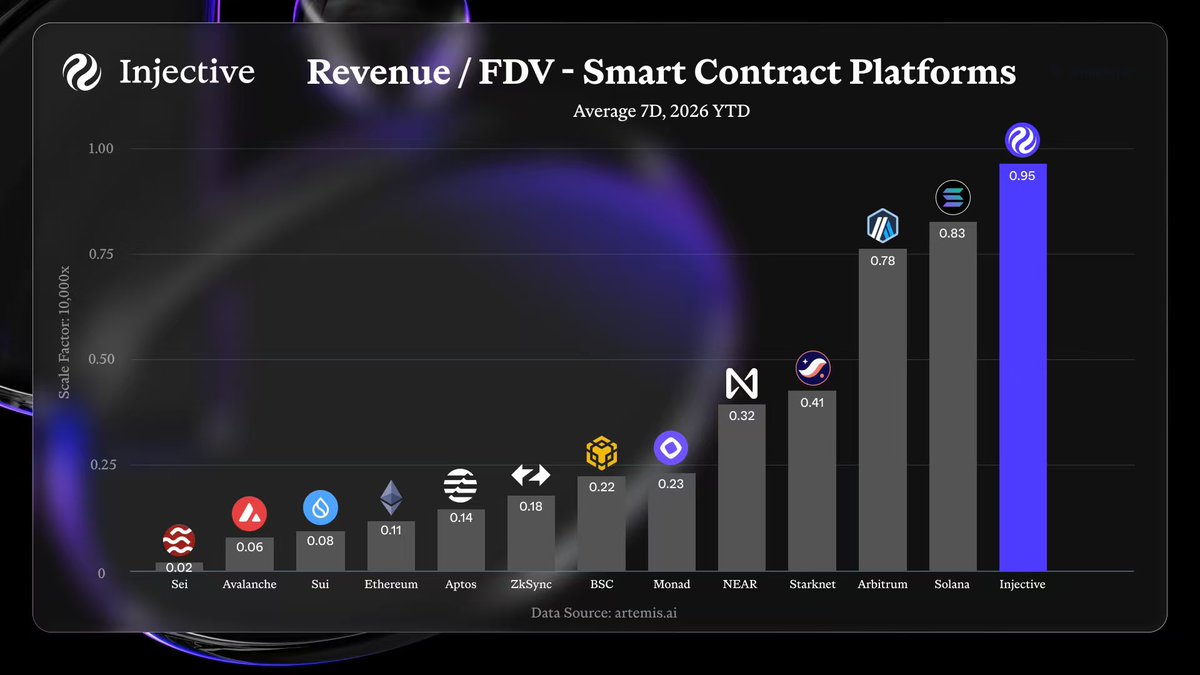
The ratio can improve through higher revenue, a lower token valuation or a combination of both, so the underlying revenue trend remains important. Its relevance to holders comes through the Community BuyBack mechanism: eligible participants commit INJ, receive a proportional share of an event’s ecosystem-revenue basket, and have their committed tokens permanently burned.
This creates a defined route between ecosystem revenue and token removal. The strength of that route should be judged through reported revenue, participation and completed burns—not the headline value of future tokenization plans.
Development work and policy engagement add context, not proof of adoption
Santiment’s table ranked Injective ninth among the AI and big-data projects shown, with a 30-day development-activity reading of 43.33. The measure tracks notable GitHub activity; it is not a sentiment ranking, developer headcount or count of completed product launches.
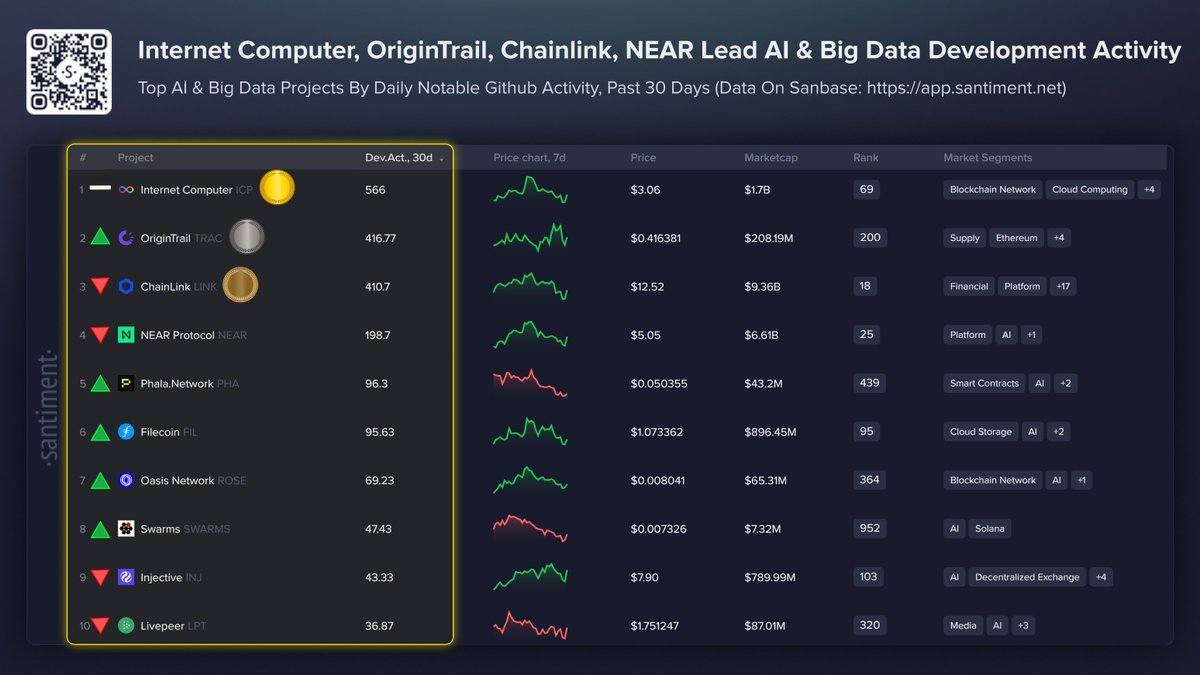
It nevertheless provides evidence of ongoing repository work alongside the commercial announcements. Taken together, these sources give a more specific picture of Injective’s progress than describing the rally as purely speculative or treating every announcement as delivered adoption.
The project has also appeared in policy discussions. AshCrypto reported meetings involving CEO Eric Chen and officials from the White House, SEC and CFTC. An SEC memorandum independently confirms an October 14 meeting involving Chen, other Injective Labs representatives and the Blockchain Association to discuss an innovation-exemption order.
The memorandum records engagement with regulators. It does not disclose a new approval for Injective products or an outcome from the discussion.
The current advance began at the August low near $3.98
The current recovery leg began from a later low near $3.98 in August, which now anchors the Fibonacci levels used on the chart.
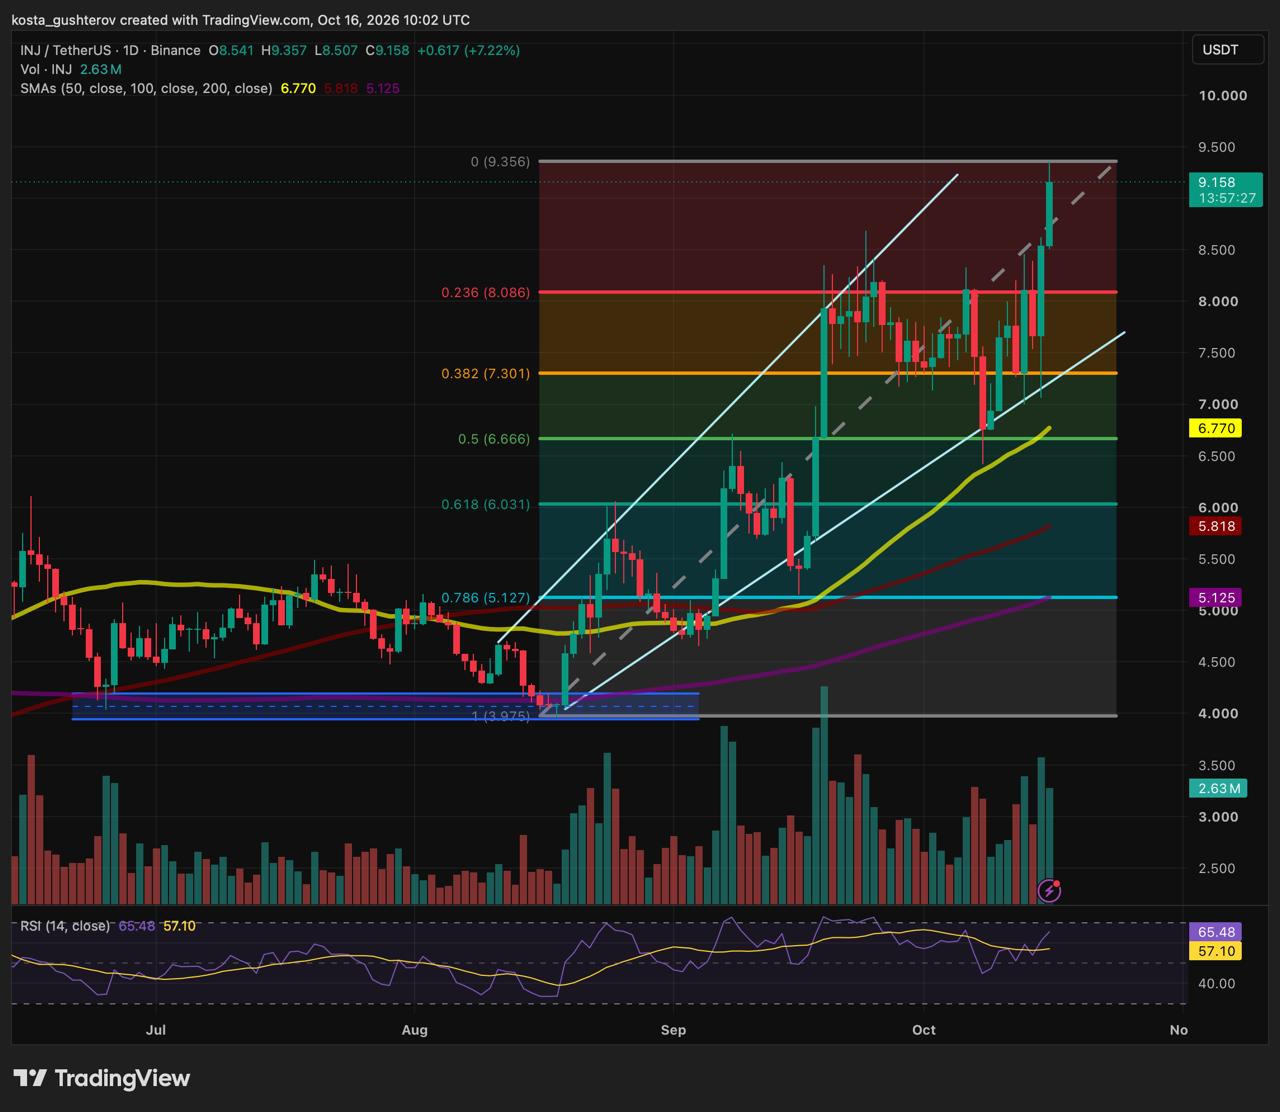
From there, INJ developed a steep rising structure, with advances interrupted by pullbacks toward its lower boundary. The latest recovery has carried price through the nearer Fibonacci references and back toward the upper part of that structure.
The October 16 daily candle opened near $8.54, dipped to approximately $8.51 and reached $9.36 before trading at $9.16. INJ has therefore moved well above $8.09, although the open candle has not yet produced a daily close above the session high.
The earlier mid-October pullback reached the area around $6.67 before INJ recovered. That zone combines the 50% Fibonacci retracement, the rising 50-day average near $6.77 and the lower boundary of the drawn rising structure.
The moving averages remain positively ordered: the 50-day SMA near $6.77 is above the 100-day SMA near $5.82, which is above the 200-day SMA near $5.13. Their upward slopes reflect the preceding advance. Because moving averages lag the price, they offer trend context and potential pullback references rather than confirmation that every nearby support will hold.
$8.09 is the first level below the breakout attempt
The Fibonacci grid runs from approximately $3.98 to $9.36. Its upper anchor is the latest session high, so these retracements describe the current measured advance rather than an established historical range with a long-tested ceiling.
| Price reference | Technical basis | Role in the current structure |
|---|---|---|
| $9.36 | Session high and upper Fibonacci anchor | Immediate breakout test |
| $8.09 | 23.6% retracement | First potential support after the latest recovery |
| $7.30 | 38.2% retracement | Intermediate level crossed repeatedly during consolidation |
| $6.67–$6.77 | 50% retracement and 50-day SMA | Recent rebound area near the rising lower boundary |
| $6.03 | 61.8% retracement | Deeper correction reference |
| $5.82 | 100-day SMA | Separate moving-average reference below $6.03 |
| $5.13 | 78.6% retracement and 200-day SMA | Closely aligned deeper support references |
The $8.09 area has been crossed several times during recent trading. Holding above it during a pullback would provide evidence that the latest move has begun to establish support, rather than simply trading through another level.
Below it, $7.30 separates a relatively shallow retreat from a move back toward the recent rebound area. Losing $7.30 would weaken the latest recovery, while the $6.67–$6.77 region would become more relevant if selling continued.
Further down, the 100-day average near $5.82 and the cluster near $5.13 should remain separate references. Their distance is too large to treat the entire interval as one tightly defined support zone. The moving averages and channel boundaries will also shift as new sessions develop.
Momentum supports the rise, but volume cannot identify the buyers
The open daily candle showed approximately 2.63 million INJ in Binance trading volume. Participation has increased compared with much of the quieter August base, although the chart also contains earlier and larger volume bars. The latest reading still represents an incomplete session.
That activity supports describing the rise as actively traded. It does not identify institutional buyers, distinguish new positions from short covering or establish that the advance will continue.
Daily relative strength index, or RSI, stood near 65.5, above its neutral midpoint of 50 and its smoothing line near 57.1. Momentum has strengthened with the rebound while remaining below the conventional overbought threshold of 70.
Trading below 70 does not measure how much upside remains. RSI can move into overbought territory during a sustained advance, and price can reverse before the indicator reaches that level.
A close above $9.36 would extend the move beyond its latest high
A daily close above $9.36, followed by trading that holds the breakout area, would strengthen the extension scenario. Sustaining the move beyond the upper guide would still require follow-through, because a brief move outside a channel can reverse.
The round $10 level would then become the next obvious psychological reference, followed by $10.50 as a higher scenario level. Neither is a calculated Fibonacci extension from the supplied chart, and a break above $9.36 would not establish all-time price discovery or prove that no historical resistance exists overhead.
If INJ rejects the latest high, $8.09 is the first pullback reference. Holding that area would keep price above a recently contested level. A deeper retreat toward $7.30 would test more of the recovery, with the rising boundary and the $6.67-$6.77 region below.
Bottom line: Injective has a tokenization pipeline, ongoing development work and a revenue-linked burn mechanism behind its broader narrative. The immediate technical test is whether INJ can close above $9.36 and then defend the recovered $8.09 area if the market pulls back.
The chart shows a sharp repricing alongside those developments. Whether the current move becomes a sustained breakout depends on INJ holding its recovered levels while Injective converts announced plans into measurable network activity, revenue and completed buyback events.
This article is provided for informational purposes only and does not constitute financial or investment advice. Technical levels reflect the supplied October 16 chart and can change as trading continues.

Kosta has reported on cryptocurrency markets and blockchain infrastructure since 2020, bringing over six years of hands-on experience in the crypto industry built through daily tracking of markets, trends, and emerging blockchain developments. Specializing in Bitcoin on-chain analysis, institutional ETF flows, and digital asset price action, his work at Coindoo has been cited by other news agencies and consistently covers market developments with a focus on data-driven reporting across Bitcoin, Ethereum, Solana, and XRP.
Over the years, Kosta has contributed to multiple crypto media outlets in different regions, authoring over 6,000 articles across the sector. His reporting spans cryptocurrency markets and the broader fintech industry, tracking not only price action but also the technological and regulatory forces shaping the ecosystem.
To support his analysis, Kosta actively leverages on-chain data and metrics from leading platforms such as Santiment, Glassnode, and CryptoQuant, enabling deeper, evidence-based market insights. He believes in the power of transparency and the data that underpins the blockchain ecosystem.
His academic background in Marketing Management from Denmark further complements his analytical approach, adding a strong understanding of communication strategy and content positioning to his work.



Be the first to comment